
CBRE’s Q2 2026 figures show availability flat and absorption positive for a fourth straight quarter. They also show asking rents down for an eleventh — and the GTA taking half of Canada’s construction starts.
Urban Land Group · August 19, 2026
CBRE has published its Toronto Industrial Figures for Q2 2026. The headline reads like stabilization: industrial availability held at 5.0% for a third consecutive quarter, and the Greater Toronto Area recorded 1.3 million sq. ft. of net absorption — a fourth straight quarter in positive territory.
Two other numbers complicate that reading. Asking rents fell for an eleventh consecutive quarter. And the GTA accounted for just over half of every square foot of industrial construction started in Canada.
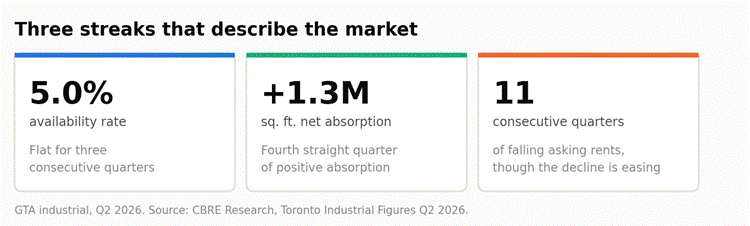
Figure 1 — The three streaks CBRE reported for the GTA in Q2 2026.
Availability is not vacancy
CBRE reports an availability rate, and it is worth being precise about what that measures. Availability counts space being marketed for lease or sublease, whether or not a tenant is still in it. Vacancy counts only space that is physically empty. Availability is the leading indicator, and it is always the higher of the two.
So 5.0% availability is a healthier reading than 5.0% vacancy would be. It also means space is reaching the market before tenants have left it — which is what a softening rent environment looks like from the inside.
A third of the demand, half of the construction
Nationally, CBRE reported 3.9 million sq. ft. of net absorption in Q2 2026, 2.4 million sq. ft. of new supply delivered, and 4.2 million sq. ft. of construction starts. Toronto’s share of each was 33.3%, 45.4% and 50.2% respectively.
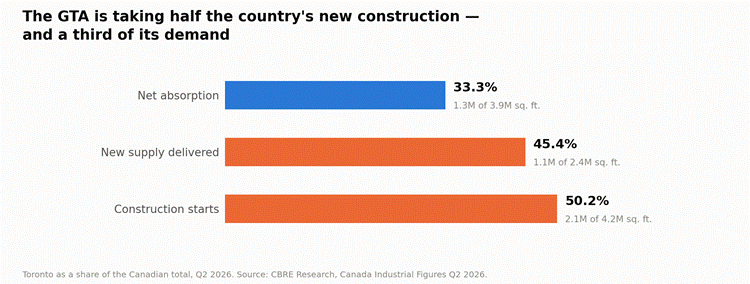
Figure 2 — Toronto’s share of the Canadian industrial total, Q2 2026.
That gap is the tension in a single line. Relative to the rest of the country, the GTA is starting new industrial product materially faster than it is currently absorbing it.
Ground-breakings are outpacing completions two to one
Six GTA buildings broke ground in Q2, totalling 2.1 million sq. ft. All six were speculative — none pre-leased. In the same quarter, roughly 1.1 million sq. ft. was delivered, of which 803,000 sq. ft. was itself speculative.
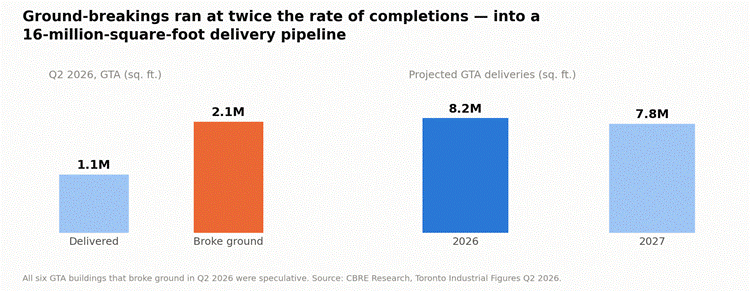
Figure 3 — GTA completions against ground-breakings, and the forward delivery pipeline.
CBRE projects 8.2 million sq. ft. of GTA deliveries in 2026 and a further 7.8 million sq. ft. in 2027: roughly 16 million square feet arriving over two years into a market where asking rents have now declined for eleven consecutive quarters. Nationally, CBRE put the average net asking rate at $14.78 per sq. ft., down 3.9% year over year.
| THE ULG VIEW The stabilization story is a demand story, and on demand it holds — four quarters of positive absorption is real. The risk sits on the supply side, and it is concentrated in the GTA. A speculative building that broke ground this quarter delivers into 2028. It will compete with roughly 16 million sq. ft. arriving ahead of it. Land priced against a pro forma that assumes rents recover to the 2022 peak will not clear. Land priced against today’s face rents — with a realistic absorption schedule and a lease-up allowance measured in quarters, not months — will. If you are underwriting a serviced industrial site in Halton, Peel or Hamilton right now, the question is not whether the market is stabilizing. It is whether your delivery date lands in front of or behind 16 million square feet of competing product. |
| A NOTE ON SOURCING CBRE’s public Toronto figures page reports the direction and duration of rent movement, not a dollar-per-square-foot figure for the GTA. The $14.78 rent cited in this note is the national average net asking rate. Any GTA-specific rent number seen elsewhere should be traced back to CBRE’s downloadable report before it is relied on. |
Sources
· CBRE Research, Toronto Industrial Figures, Q2 2026. https://www.cbre.ca/insights/figures/toronto-industrial-figures-q2-2026
· CBRE Research, Canada Industrial Figures, Q2 2026. https://www.cbre.ca/insights/figures/canada-industrial-figures-q2-2026
Charts constructed by Urban Land Group from figures published by CBRE Research; percentage shares are ULG calculations from CBRE’s reported totals. CBRE is the source of the underlying data and is not affiliated with this commentary. General market commentary; not investment or financial advice.