
Housing Starts, Checked Line by Line.

A political post made five claims about CMHC’s October data and the immigration plan. Three hold up. One is not a government figure. And the most useful number is in neither argument
November 20, 2026
CMHC’s October housing starts release has been picked up in political commentary, with a set of figures attached to it. This note checks each claim against the source documents and takes no position on the politics. Where the data supports a claim we say so, and where it does not we say that too.
The short version: the direction is real, the headline number is quoted correctly, the comparison to a target needs a date attached, and one figure is not a government number at all.
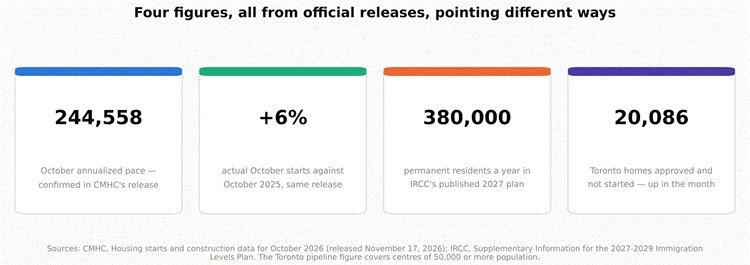
Figure 1. Four official figures, pointing in different directions.
What CMHC actually published
The release is dated November 17, 2026 and the number is confirmed: “The total monthly SAAR of housing starts for all areas in Canada was down 2% in October (244,558 units) compared to September (250,072 units).” The six-month trend fell 1.7% to 246,231.
But the same release carries four different measures and they do not all point the same way. Actual starts in centres of 10,000 or more were 21,059 in October 2026 against 19,806 a year earlier — up 6%. Year to date, 192,023 against 197,839, down 3%. So: the annualized pace is down, the trend is down, the year is down, and the single month is up.
CMHC’s deputy chief economist Kevin Hughes said October’s results “signal reduced momentum for housing construction”, driven by declines in Ontario, British Columbia and the Atlantic provinces. Ontario’s trend fell 8%, Toronto’s 10%. On balance the “starts are falling” reading is the better-supported one — but anyone quoting a single line from this release can get whichever answer they want.
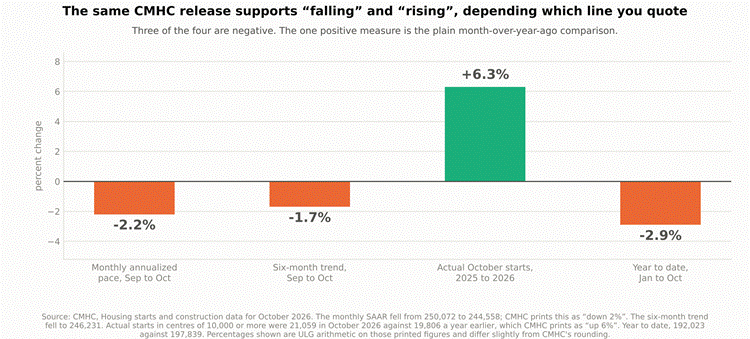
Figure 2. Four measures from one release. Three negative, one positive.
Half of what, by when
244,558 is 48.9% of 500,000, so “less than half” is arithmetically correct. The question is what it is half of, and when it was supposed to be reached.
The target is 500,000 homes a year. The housing minister described it to the House finance committee in October 2025 as “a longer-term goal over a decade”, adding that it is “still very aggressive and ambitious to get to 500,000 over the next decade.” Getting there from today’s pace requires roughly 7.4% compound growth a year for ten years — a demanding path, but a path, not a missed deadline.
The sharper criticism is one neither side makes: no interim milestone has been published. Without a stated figure for 2027 or 2028, the target cannot be held to account in either direction. A government can always say the decade is not up; a critic can always say the gap is enormous. Both are right and neither is testable.
One more note on the arithmetic. “Doubling” is loose. Against CMHC’s September 2025 figure of 277,147 starts, 500,000 is about 1.8 times, not two.
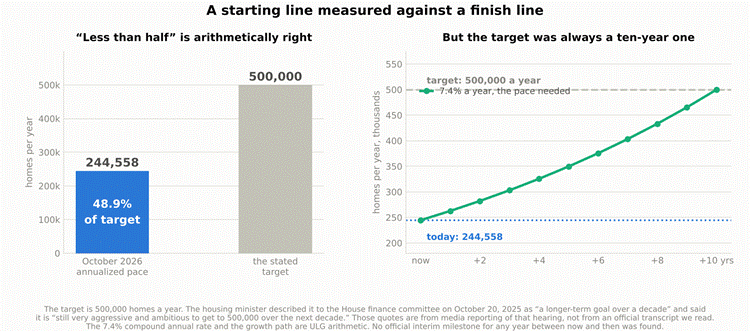
Figure 3. The gap is real. The horizon changes what it means.
The 662,000 figure is not IRCC’s
This is the clearest factual problem. IRCC’s Supplementary Information for the 2027-2029 Immigration Levels Plan, issued November 5, 2026, states: “Overall permanent resident admissions will remain at 380,000 for all three years.” Flat, not increased, for 2027, 2028 and 2029.
The plan does introduce a new time-limited measure to process additional permanent residence applications in 2027 — and attaches no number to it. The only in-Canada transition figures IRCC publishes are Budget 2025 initiatives for up to 115,000 Protected Persons and 33,000 work permit holders, and those span 2026 and 2027 together.
A figure near 660,000 has circulated, from a bank’s estimate that roughly 280,000 temporary residents will convert to permanent residence in 2027 on top of new admissions. That is private research, and the department has not confirmed whether in-Canada transitions sit inside or on top of the 380,000. Quoting it as “the Liberals plan to welcome 662,000” presents an analyst’s estimate as a government commitment.
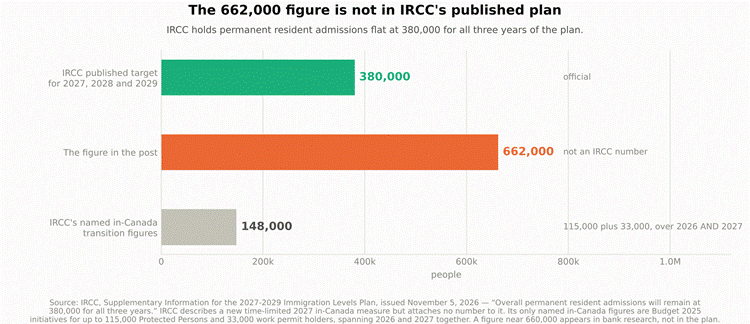
Figure 4. What IRCC published, against the figure in circulation.
The number neither argument uses
Here is what a land person should actually take from this release. In the Toronto CMA, homes approved but not yet started rose to 20,086 in October while units under construction fell 3.3% to 85,216. Nationally the pending-starts count fell 3% and Hughes said that decline “should be monitored carefully.”
Twenty thousand approved Toronto homes are sitting unbuilt. Those projects have their permission. Whatever is stopping them, it is not zoning approval and it is not a missing permit. Ontario has already cut base development charges by 50%, with full elimination available where a CMHC-prescribed foundation is in place by October 31, 2027 — and the approved-but-unstarted count still went up.
That observation cuts against both sides of this argument. It does not show that cutting charges and red tape is wrong; reducing cost always helps a marginal project. It shows that this release does not evidence permission as the binding constraint, and that a policy debate conducted entirely about approvals is arguing about a stage of the process that these 20,086 homes have already cleared.
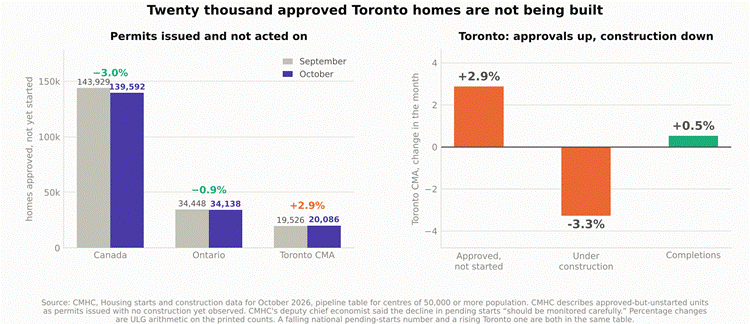
Figure 5. Approvals rising, construction falling, in the same market.
Claim by claim
Set out individually, the five claims land in three different places. Two are supported by the data, two need a qualifier before they mean what they appear to mean, and one is not a government figure.
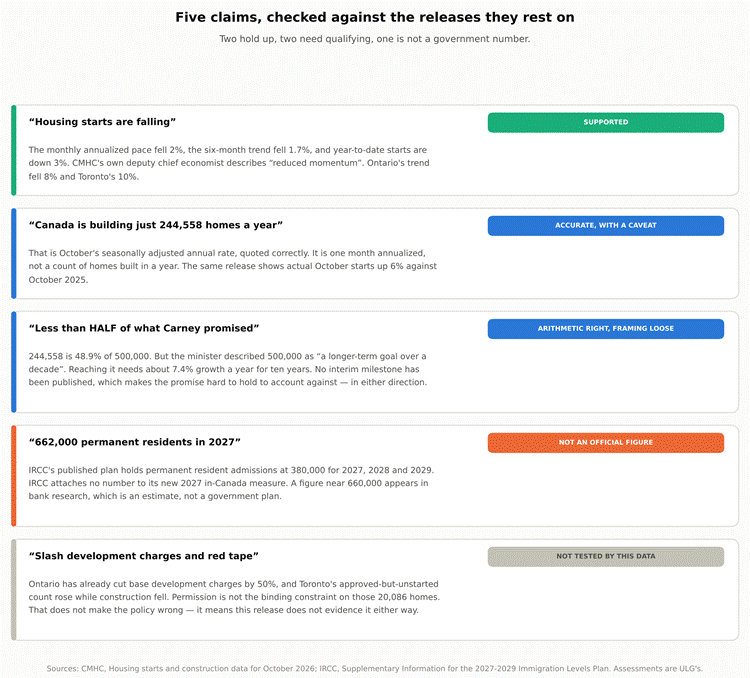
Figure 6. Each claim against the document it rests on. Assessments are ours.
| THE ULG VIEW The underlying signal is real and worth taking seriously regardless of who is making the argument. Ontario’s starts trend fell 8% and Toronto’s fell 10% in a single month, and CMHC’s own economist used the phrase “reduced momentum”. If you are underwriting absorption or construction timing in the GTA, that is the finding, not the politics. Be careful quoting the 244,558 figure. It is one month’s pace annualized, and the same release shows actual October starts up 6% against a year earlier. A monthly SAAR is volatile by construction; the six-month trend and the year-to-date figures are the more reliable reads, and both are negative. Use those instead and you will be on firmer ground than either side of this exchange. Do not repeat the 662,000 figure as a government number. IRCC’s published plan says 380,000 for each of 2027, 2028 and 2029. The larger number is a bank’s estimate of what a measure IRCC has not quantified might produce. If a client or a capital partner raises it, the correction is one sentence and it is worth making. The 20,086 approved-and-unstarted Toronto homes are the most useful figure in this release for anyone in land. Entitled, permitted projects not proceeding is a feasibility and cost-of-capital problem, not an approvals problem. That is constructive for well-located entitled land held by someone who can carry it, and it is a warning for anyone whose model assumed shovels this year. |
| WHAT IS CONFIRMED AND WHAT IS NOT Confirmed from primary sources. The October SAAR of 244,558 against September’s 250,072, the six-month trend of 246,231, actual starts of 21,059 against 19,806, year-to-date 192,023 against 197,839, the Ontario and Toronto trend changes, the pipeline table and the quotes from CMHC’s deputy chief economist are all from CMHC’s Housing starts and construction data for October 2026, released November 17, 2026. The immigration figures are from IRCC’s Supplementary Information for the 2027-2029 Immigration Levels Plan, issued November 5, 2026. Note on revisions. CMHC’s September release reported that month’s SAAR as 248,896. The October release reports September as 250,072. Monthly figures are revised; a change computed from two different releases will not match one computed within a single release. From media, not an official transcript. The housing minister’s description of 500,000 as “a longer-term goal over a decade” comes from press reporting of an October 20, 2025 House finance committee appearance. We did not read the committee transcript. We also could not reach an official Government of Canada page stating the target and its horizon; the department’s site refused our request. Partly unverified. Some single-month Ontario and Toronto figures appeared only in a summarized portion of the CMHC release rather than in the verbatim tables, and we have not used them. The figures quoted above are from the parts we read verbatim. Our arithmetic. The percentage changes, the 48.9% share, the 7.4% compound growth path and the 1.8 times ratio are ULG calculations on the printed figures. They differ slightly from CMHC’s own rounding. On the politics. This note assesses factual claims against source documents. It takes no position on housing policy, immigration levels or any party’s program, and the assessments in Figure 6 are about evidence, not about whether a policy is good. |
Sources
Official and primary sources
· CMHC, Housing starts and construction data for October 2026 (released November 17, 2026). https://www.cmhc-schl.gc.ca/media-newsroom/news-releases/2026/housing-starts-construction-data-october-2026
· CMHC, Housing starts and construction data for September 2026. https://www.cmhc-schl.gc.ca/media-newsroom/news-releases/2026/housing-starts-construction-data-september-2026
· CMHC, Monthly Housing Starts and Other Construction Data Tables. https://www.cmhc-schl.gc.ca/professionals/housing-markets-data-and-research/housing-data/data-tables/housing-market-data/monthly-housing-starts-construction-data-tables
· IRCC, Supplementary Information for the 2027-2029 Immigration Levels Plan (issued November 5, 2026). https://www.canada.ca/en/immigration-refugees-citizenship/corporate/immigration-system/levels/supplementary-immigration-levels-2027-2029.html
· Housing, Infrastructure and Communities Canada, Build Canada Homes (listed for the reader; not retrievable at time of writing). https://housing-infrastructure.canada.ca/bch-mc/about-apropos-eng.html
Media and other material (not official)
· National Post, report of the housing minister’s October 20, 2025 finance committee testimony describing the 500,000 target as a decade-long goal. https://ca.news.yahoo.com/building-500-000-homes-annually-194831252.html
· The Canadian Press, “CMHC’s annual pace of housing starts in October down two per cent from September”, November 17, 2026. https://www.ctvnews.ca/business/article/cmhcs-annual-pace-of-housing-starts-in-october-down-2-from-september/
Sunny Gawri
Urban Land Group — land development advisory and commercial brokerage
Sales Representative, Royal LePage Signature Realty, Brokerage — registered in Ontario since 2013
30 Eglinton Avenue West, Mississauga, Ontario
This note is general market commentary compiled from public sources. It is not an appraisal, not a legal opinion and not political advocacy. Figures described as ULG calculations are our own arithmetic on the cited public data. Housing starts figures are revised monthly by the issuing agency. Confirm all figures against the current release before relying on them.