
Toronto Is Short 246,000 Rental Homes. Ontario’s Real Gap Is Somewhere Else.

A striking number is circulating from a source we could not verify. CMHC’s official framework uses a different method, reaches a different kind of answer, and says the largest proportional shortage in Ontario is not in Toronto at all.
Urban Land Group · October 26, 2026
A widely shared post states that Metro Toronto is short approximately 246,000 rental homes and Metro Vancouver 81,700, measured against the demand expected from population demographics. The post describes these as missing households — people who would have formed their own household but instead live with their parents as adults or in overcrowded housing. It attributes the figures to a new product called the Canadian Housing Atlas.
We could not locate the Atlas, its methodology or its data. That is not an accusation; new products take time to surface. But until the method is published, the figure is a claim rather than a statistic, and missing-household estimates are unusually sensitive to the benchmark rate the author chooses.
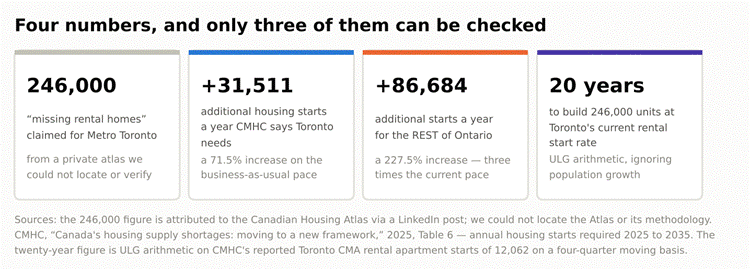
Three of these four numbers come from CMHC and can be checked. The first cannot.
Canada’s housing agency has looked at this method and chosen another
CMHC publishes an official framework for estimating housing need. It describes the demographic approach directly — adding “how many additional households there would’ve been if house prices hadn’t been so high” — and then explains why its own model does not use it: because that approach excludes explicit affordability targets and excludes demand rising as incomes grow and housing costs fall.
Instead CMHC models how much building is required to return house prices to a defined ratio against income, and it reports the answer as annual housing starts by region rather than as a cumulative gap. It says so explicitly: it presents the number of starts required per year rather than a cumulative total. The words “headship” and “missing households” do not appear anywhere in the report.
Neither method is wrong. They answer different questions. But a cumulative number and an annual-starts number are not interchangeable, and the cumulative one is the one that travels on social media.
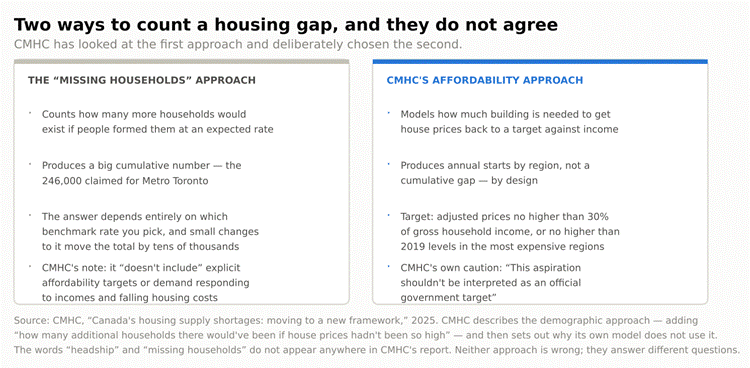
Both descriptions are drawn from CMHC’s own framework report.
And CMHC’s Ontario numbers point somewhere unexpected
For the decade to 2035, CMHC estimates Toronto needs 75,565 housing starts a year against a business-as-usual pace of 44,054 — an increase of 71.5%. Ottawa-Gatineau needs 26,338 against 10,313, an increase of 155.4%. The rest of Ontario needs 124,795 against 38,111: an increase of 227.5%.
Toronto has the smallest proportional gap in the province. The largest is everywhere else — Hamilton, Halton outside Toronto, Niagara, Waterloo, London, the mid-sized cities. Across the three regions, Ontario would have to go from 92,478 starts a year to 226,698, a 145% increase, or roughly 1.34 million additional units over the decade.
CMHC attaches an important caution to all of it: the affordability aspiration behind these numbers “shouldn’t be interpreted as an official government target.”
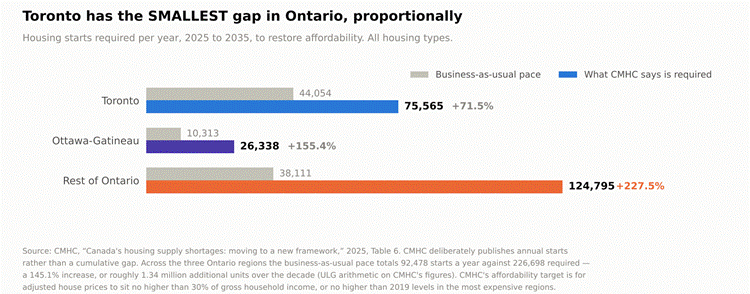
CMHC Table 6. The percentage increases are as published; the Ontario totals are ULG arithmetic.
What is actually being built
Whichever estimate you prefer, the construction side is the same. Toronto CMA purpose-built rental apartment starts reached 12,062 on a four-quarter moving basis at Q2 2026 — overtaking condominium apartment starts at 8,289 for the first time in decades. In the City of Toronto proper, 156 condominium units started in the first half of 2026.
At that rental pace, 246,000 units takes roughly twenty years, before accounting for population growth or demolitions. The two estimates disagree about the size of the hole. They agree completely about the rate at which it is being filled.
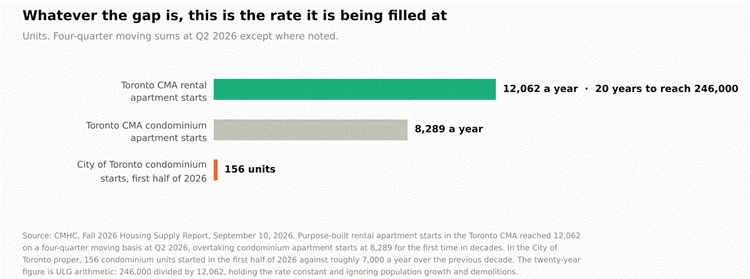
CMHC Fall 2026 Housing Supply Report. The twenty-year figure is ULG arithmetic.
| THE ULG VIEW We could not verify the 246,000 figure, and that matters more than it sounds. The post attributes it to the Canadian Housing Atlas, a new product credited to Stephen Rouse. We could not locate the Atlas, its methodology or its data. Until the method is published, the number is a claim, not a statistic — and “missing households” estimates are unusually sensitive to the benchmark the author picks. Canada’s own housing agency has looked at this approach and deliberately chosen a different one. CMHC describes the demographic method — adding “how many additional households there would’ve been if house prices hadn’t been so high” — and then explains that its own model does not use it, because it excludes explicit affordability targets and demand responding to incomes and falling costs. The words “headship” and “missing households” do not appear anywhere in CMHC’s framework report. CMHC also deliberately stopped publishing a cumulative gap. It now reports the number of housing starts required per year rather than a total. That is a methodological choice worth respecting: big round cumulative numbers travel well on LinkedIn and tell you almost nothing about what has to happen in any given year. The CMHC Ontario numbers are the ones to actually use, and they point somewhere unexpected. Toronto needs 75,565 starts a year against a business-as-usual 44,054 — an increase of 71.5%. Ottawa-Gatineau needs 26,338 against 10,313, up 155.4%. The rest of Ontario needs 124,795 against 38,111, up 227.5%. Toronto has the smallest proportional gap in the province. That inverts where most of the industry is looking, and it maps directly onto our footprint. “Rest of Ontario” is Hamilton, Halton outside Toronto, Niagara, Waterloo, Woodstock, London — the markets where we actually transact. CMHC’s model says those markets collectively need to more than triple their output. Across the three Ontario regions the pace has to go from 92,478 starts a year to 226,698, an increase of 145%, or roughly 1.34 million additional units over the decade. Hold that against what is being built and the tension is obvious. Toronto CMA rental apartment starts are running at 12,062 a year on a four-quarter basis, condominium starts at 8,289, and the City of Toronto managed 156 condominium starts in the first half of 2026. At the current rental pace, 246,000 units takes twenty years — before any population growth or demolition. Both the Atlas number and the CMHC number describe the same reality from different angles: the arithmetic does not close. The filtering argument in the post is the part worth keeping. Today’s expensive new rental becomes the attainable rental of twenty years from now, and a tenant moving into new stock vacates older, cheaper stock. That is real, it is how housing markets have always worked, and it is the strongest argument for building market-rate rental that most affordability advocates will not make. It does not require the 246,000 figure to be correct. One note on who is speaking. The post is from a research lead at an institutional real estate investor and asset manager. The analysis may be entirely sound — but “we need far more rental housing” is also the commercial position of the firm. Weigh it the same way you would weigh a brokerage forecast: on the method, not the masthead. What we would actually do with this. Nothing changes on a live file. But if CMHC’s regional split is right, the secondary Ontario markets have a larger proportional supply deficit than Toronto and a lower land basis to build against. That is the thesis underneath our urban edge work, and this is the first official dataset we have seen that states it in those terms. |
| WHAT IS CONFIRMED AND WHAT IS NOT The 246,000 and 81,700 figures are unverified. They are attributed in a LinkedIn post to the Canadian Housing Atlas. We searched and could not find the Atlas, its publisher, its methodology or its underlying data. We are reporting the claim as a claim and have not reproduced it as a finding. The CMHC figures are official and verified against the source document. “Canada’s housing supply shortages: moving to a new framework,” 2025, Table 6. The Toronto, Ottawa-Gatineau and Rest of Ontario start figures and the percentage increases are as published. CMHC’s affordability target is that adjusted house prices sit no higher than 30% of gross household income, or no higher than 2019 levels in the most expensive regions. CMHC explicitly disclaims its own number as a target. The report states that the affordability aspiration “shouldn’t be interpreted as an official government target.” CMHC’s report carries conflicting dates. The cover says June 2025 and the running header says March 2025. We have cited it as 2025 without resolving which is correct. The Ontario totals and the twenty-year figure are ULG arithmetic. Adding the three CMHC regions gives 92,478 business-as-usual against 226,698 required. Dividing 246,000 by 12,062 gives roughly twenty years. Both hold rates constant and ignore population growth, demolitions and household formation — they illustrate scale, they are not projections. CMHC’s figures cover all housing types; the 246,000 claim is rental-only. They are not directly comparable and we have not compared them as though they were. We could not retrieve Statistics Canada census data on young adults living with their parents, which would be the official way to test the post’s claim about where the missing households are. The pages we tried returned the wrong publication or failed. |
SOURCES
Official sources
· CMHC — Canada’s housing supply shortages: moving to a new framework, 2025 (the Ontario regional figures and the methodology) https://assets.cmhc-schl.gc.ca/sites/cmhc/professional/housing-markets-data-and-research/housing-research/research-reports/accelerate-supply/canadas-housing-supply-shortages-new-framework/2025-canadas-housing-supply-shortages-new-framework-en.pdf
· CMHC — Fall 2026 Housing Supply Report, September 10, 2026 (Toronto rental and condominium starts) https://www.cmhc-schl.gc.ca/professionals/housing-markets-data-and-research/market-reports/housing-market/housing-supply-report
· CMHC — Housing markets, data and research https://www.cmhc-schl.gc.ca/professionals/housing-markets-data-and-research
· CMHC — Rental Market Reports, major centres https://www.cmhc-schl.gc.ca/professionals/housing-markets-data-and-research/market-reports/rental-market-reports-major-centres
· Statistics Canada — Canadian Housing Statistics Program https://www.statcan.gc.ca/imdb-bmdi/5257-eng.htm
· Statistics Canada — Census of Population 2021, families, households and marital status https://www12.statcan.gc.ca/census-recensement/2021/rt-td/fam-eng.cfm
· City of Toronto — Toronto Housing Data Book https://www.toronto.ca/city-government/data-research-maps/toronto-housing-data-hub/toronto-housing-data-book/
Unverified
· Canadian Housing Atlas — credited in the originating post as the source of the 246,000 and 81,700 figures; we were unable to locate it or its methodology https://www.cmhc-schl.gc.ca/professionals/housing-markets-data-and-research
Prepared by Urban Land Group. Sunny Gawri is a registered sales representative with Royal LePage Signature Realty, Brokerage. This document is market commentary prepared for discussion purposes. All arithmetic identified as ULG calculation is our own and is not sourced from CMHC, Statistics Canada or any other body. Nothing here is an appraisal, an Opinion of Value, or investment, legal or tax advice.