
Ontario Led The Permit Rebound. It Did Not Lead A Supply Rebound.
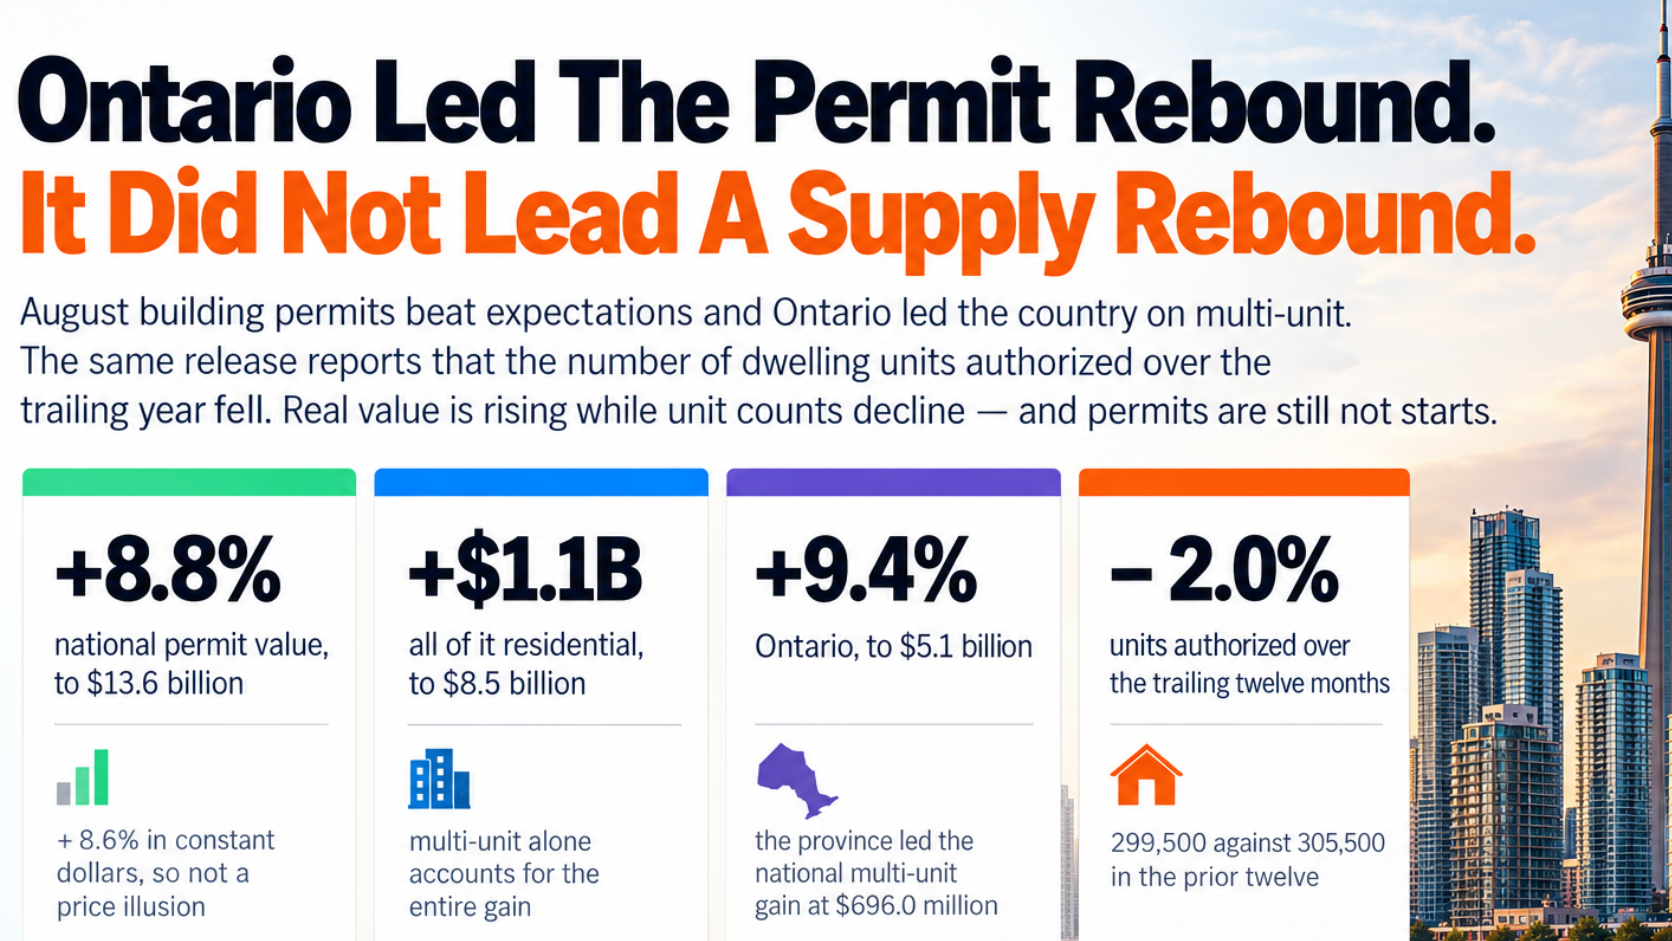
August building permits beat expectations and Ontario led the country on multi-unit. The same release reports that the number of dwelling units authorized over the trailing year fell. Real value is rising while unit counts decline — and permits are still not starts.
Urban Land Group · October 15, 2026
Statistics Canada released building permits for August 2026 on October 14. The total value of permits issued across Canada rose $1.1 billion, or 8.8%, to $13.6 billion. Market commentary framed it as a substantial beat against an expected gain of roughly 2%. Essentially all of the increase was residential: the residential component rose $1.1 billion to $8.5 billion, with multi-unit up $1.1 billion to $5.8 billion and single-family essentially unchanged at $2.6 billion.
Ontario led. The province’s total permit value rose 9.4% to $5.1 billion, and Ontario posted the largest multi-unit gain of any province at $696.0 million, ahead of British Columbia at $189.8 million and Alberta at $115.9 million. Non-residential was close to flat nationally, down $29.8 million, and Ontario institutional permits fell $211.2 million.

Three headline figures, and the fourth number from the same release that complicates them.
First, the test the print passes
The reflex with a nominal rebound in a high-cost construction market is to suspect price rather than volume. Statistics Canada publishes a constant-dollar series alongside the current-dollar headline, and on that basis permit value rose 8.6% month over month and 12.4% year over year. The move survives the deflator almost intact. This is not an inflation artifact, and anyone dismissing it as one has not checked.
Then, the number sitting beside it
The same release reports units authorized. Over the twelve months from September 2025 to August 2026, 299,500 dwelling units were authorized across Canada, down from 305,500 in the preceding twelve-month period — a decline of 2.0%. So real permit value is rising at a double-digit annual rate while the count of dwellings actually being authorized is falling.
Those two can coexist, and the explanation is cost and mix rather than volume: each authorized unit is carrying more real dollars than it did a year ago. For an underwriter that distinction matters more than the headline. Permit value is a measure of money. Units authorized is the measure of supply.
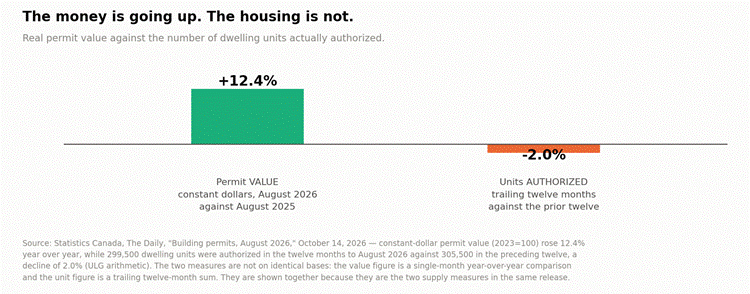
The two supply measures in the same release, pointing in opposite directions.
What carried the month, and what it conceals
The composition is narrow. Multi-unit residential accounts for the entire national gain. Single-family was flat at a $0.7 million decline. On the non-residential side, the aggregate change of $29.8 million looks like nothing happened, but commercial fell $380.0 million while industrial rose $317.3 million. Describing non-residential as flat reports the net and discards the signal.
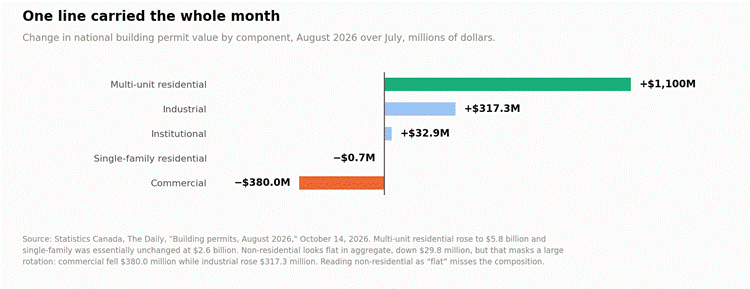
Non-residential was not flat. It rotated.
The provincial detail carries the same warning. Ontario led the multi-unit gain by a wide margin, but Ontario also moved against the national direction on institutional: national institutional permits rose $32.9 million on the month, led by Quebec at $188.5 million, while Ontario institutional fell $211.2 million. The commercial and institutional pipeline in Ontario is not participating in this rebound.
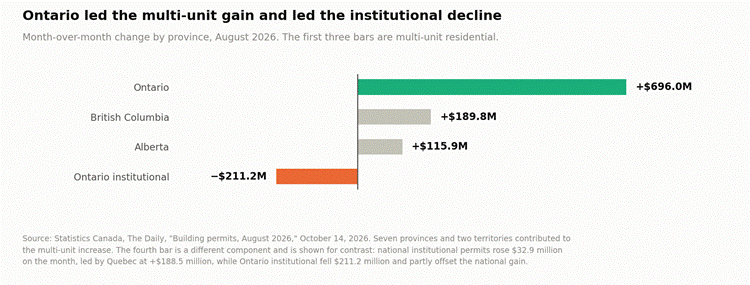
The first three bars are multi-unit. The fourth is a different component, shown for contrast.
| THE ULG VIEW Every headline figure checks out, and the deflator test it should have failed, it passed. The first thing to do with a nominal rebound in a high-cost construction market is strip out price. We expected that to kill most of the move. It did not: constant-dollar permit value rose 8.6% month over month against 8.8% in current dollars, and 12.4% year over year. This is not an inflation artifact. Credit where it is due — the print is real. But the release contains a second number that points the other way, and it is the one that measures supply. Over the twelve months to August 2026, 299,500 dwelling units were authorized, against 305,500 in the preceding twelve — down 2.0%. Real permit value is rising while the number of dwellings being authorized is falling. The money is going up; the housing is not. One strong month of multi-unit value sits inside a trailing-year unit count that is still declining. So we would not downgrade conviction yet — we would change what we are watching. A single month of authorization value is weak evidence about supply two to three years out. Permits are lumpy: a handful of towers reaching authorization in one CMA can move a provincial number by hundreds of millions, and Ontario’s entire $696.0 million multi-unit gain is well within the range a few large projects can produce. September permits are not the confirming signal. Starts are. And on starts, the evidence runs the other way. CMHC’s Fall 2026 Housing Supply Report records 156 condominium units started in the City of Toronto in the first half of 2026, against roughly 7,000 a year over the previous decade, and states that condominium project launches have largely stalled. An authorization is a permit, not a crane. The gap between what is authorized and what is built is precisely where the entitled-land thesis lives, and that gap is currently very wide. The right reading of “first to shovel” is narrower than it sounds. If authorizations are running ahead of starts, the scarce thing is not the permit and not the entitlement — it is the capital stack and the trade capacity to convert either one into construction. That favours sites that can carry CMHC-financeable rental, because that is the only product type currently reaching a shovel at scale. It does not favour paying up for an entitlement on the assumption that someone will build it. The non-residential read should be sharper than “flat.” Aggregate non-residential fell $29.8 million, which looks like nothing. Underneath it, commercial fell $380.0 million while industrial rose $317.3 million. That is a rotation, not a flat line. And nationally institutional permits rose $32.9 million led by Quebec at +$188.5 million, while Ontario institutional fell $211.2 million — so Ontario did not merely lag on institutional, it moved against the national direction. What would actually change our mind. Two consecutive months of multi-unit authorization strength accompanied by a rising trailing-twelve-month unit count, and a visible turn in CMHC starts. Value alone is not enough, and one month is not a trend. Until both move together, the supply-scarcity case for entitled rental land stands — with the caveat properly stated rather than assumed. |
| WHAT IS CONFIRMED AND WHAT IS NOT Every figure in this note is from the Statistics Canada release of October 14, 2026 and was verified against it. The +8.8% to $13.6 billion, the $1.1 billion residential gain to $8.5 billion, Ontario at +9.4% and $5.1 billion, the +$696.0 million Ontario multi-unit gain, the −$29.8 million non-residential change and the −$211.2 million Ontario institutional change all appear as published. Statistics Canada does not publish Ontario’s total dollar change. The release gives Ontario’s percentage change and level. Applying 9.4% to the level implies roughly $0.4 billion, but that is ULG arithmetic, not a published figure. The two bars in the third chart are not on identical bases. The +12.4% is a single-month year-over-year comparison of constant-dollar value. The −2.0% is a trailing-twelve-month unit sum against the preceding twelve. They are shown together because they are the two supply measures in the same release, not because they are directly comparable. Building permits are authorizations, not construction. A permit may lapse, be amended, or never be acted on. The lag between authorization and start varies by project type and financing, and permits are among the more volatile monthly indicators Statistics Canada publishes. The consensus comparison is market commentary, not official. The characterisation of this print as a beat against an expected +2.0% comes from market reporting, not from Statistics Canada, which does not publish or endorse consensus forecasts. The July multi-unit figure referenced in prior ULG commentary is not restated here. Statistics Canada revises these series; any month-to-month comparison should be read against the current vintage of the table rather than against a previously published figure. |
SOURCES
Official and primary sources
· Statistics Canada — The Daily, Building permits, August 2026, released October 14, 2026 https://www150.statcan.gc.ca/n1/daily-quotidien/261014/dq261014a-eng.htm
· Statistics Canada — Building permits, monthly tables (Table 34-10-0066-01) https://www150.statcan.gc.ca/t1/tbl1/en/tv.action?pid=3410006601
· Statistics Canada — Building permits survey, definitions and methodology https://www23.statcan.gc.ca/imdb/p2SV.pl?Function=getSurvey&SDDS=2802
· CMHC — Fall 2026 Housing Supply Report, September 10, 2026 (condominium and rental apartment starts) https://www.cmhc-schl.gc.ca/professionals/housing-markets-data-and-research/market-reports/housing-market/housing-supply-report
Market commentary (not official)
· BNN Bloomberg — Statistics Canada reports building permits up $1.1B in August at $13.6B https://www.bnnbloomberg.ca/business/economics/2026/10/14/statistics-canada-reports-building-permits-up-11b-in-august-at-136b/
· InvestingLive — Canada August building permits rise 8.8% versus 2.0% expected https://investinglive.com/news/canada-august-building-permits-rise-8-8-vs-2-0-expected/
Prepared by Urban Land Group. Sunny Gawri is a registered sales representative with Royal LePage Signature Realty, Brokerage. This document is market commentary prepared for discussion purposes. All arithmetic identified as ULG calculation is our own and is not sourced from Statistics Canada, CMHC or any government body. Nothing here is an appraisal, an Opinion of Value, or investment, legal or tax advice.