
Canada Is Building Retail at 0.6% of Its Inventory a Year. Toronto Is Building Even Less.
The retail pipeline has fallen to 4.9 million square feet, 43% of it in Calgary. Vacancy is 2.3% in the GTA and almost nothing new is coming — while Ontario just posted the largest retail sales decline in the country.
Urban Land Group · October 5, 2026
JLL’s fall retail report has Canadian retail construction starts down more than 40% in the first half of 2026, with space under construction falling to 4.9 million square feet from a 6.2-million-square-foot peak in early 2025 — a decade low. Against roughly 805 million square feet of existing inventory, that is a replacement rate of about 0.6% a year. National vacancy is 2.5%.
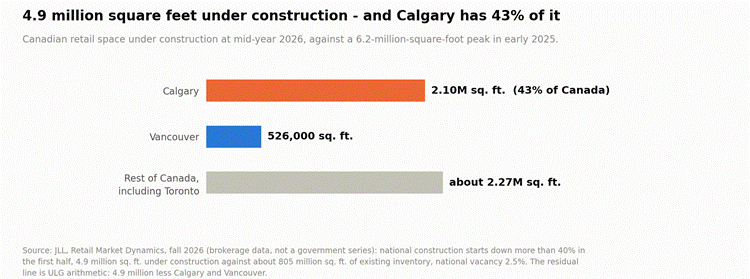
Figure 1 — Where the remaining pipeline is.
Calgary alone has 2.1 million square feet under construction — about 43% of the national total — on Costco-, Walmart- and Real Canadian Superstore-anchored projects serving new residential trade areas, with roughly 80% of that pipeline pre-leased.
Toronto: tightest market, smallest pipeline
The GTA is the mirror image. Vacancy is 2.3%, asking rents average $37.19 per square foot, and space under construction has fallen more than 50% year over year. First-half leasing dropped 15% to 1.3 million square feet — which JLL attributes not to weak demand but to empty shelves: “When there is not much meaningful to lease, leasing falls.” Toronto still accounted for 38% of notable store-opening announcements across major markets.
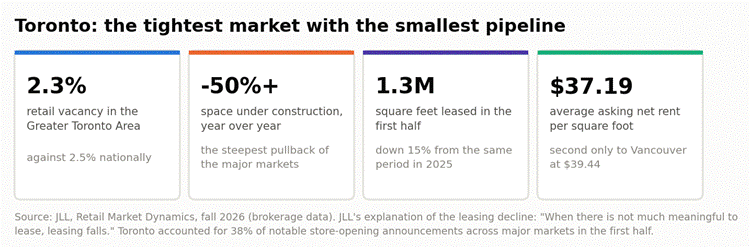
Figure 2 — Greater Toronto retail, mid-year 2026.
What is being built is narrow and specific: 96% of daily-needs centres completed since 2022 are grocery anchored, up from 74% between 2016 and 2021, and value-oriented grocers now account for 52% of the pipeline against 38% a decade ago. In the GTA the examples are Costco and Fortinos projects in Halton Region.
The demand side, from the official series
Before treating 2.3% vacancy as a rent-growth thesis, read what Statistics Canada published for July.
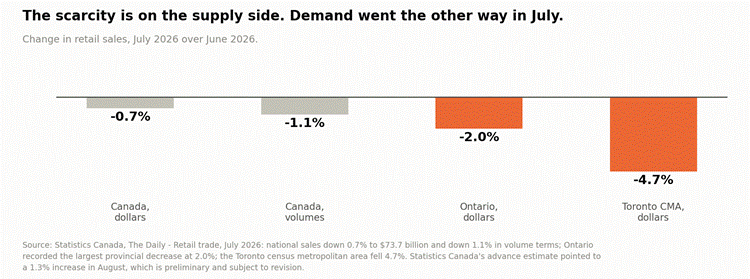
Figure 3 — Retail sales, July 2026.
National retail sales fell 0.7% to $73.7 billion and 1.1% in volume terms. Ontario recorded the largest provincial decline at 2.0%, and the Toronto CMA fell 4.7%. The advance estimate for August was positive at 1.3%, but preliminary. National rent growth has already slowed to 2.5% from a 4.9% peak in late 2022.
| WHOSE DATA THIS IS There is no government vacancy, rent or construction series for Canadian retail property. The pipeline, vacancy, rent, leasing and grocery-anchor figures are all from JLL’s fall 2026 Retail Market Dynamics report as reported in the trade press; we have not read the report itself. Brokerages define vacancy, availability and “under construction” differently, so these numbers do not reconcile with another firm’s. The demand figures are official: Statistics Canada’s The Daily for July 2026 — national retail sales down 0.7% to $73.7 billion, down 1.1% in volume terms, Ontario down 2.0%, Toronto CMA down 4.7%, with an advance estimate of plus 1.3% for August that is preliminary. The Ontario population figures are the Province’s own demographic quarterly. The replacement-rate and residual-pipeline calculations are ULG arithmetic on JLL’s published figures. |
| THE ULG VIEW The scarcity is real, and it is a supply story, not a demand story. 4.9 million square feet under construction against roughly 805 million of existing inventory is a replacement rate of about 0.6% a year — ULG arithmetic on JLL’s own figures, and barely enough to cover obsolescence. Toronto has the tightest vacancy and the sharpest construction pullback at the same time. That is why rent growth has slowed to 2.5% from a 4.9% peak while vacancy sits at 2.3%: landlords have pricing power from a lack of alternatives, not from tenants outbidding each other. Set it against what Statistics Canada published for July. Ontario posted the largest provincial retail sales decline in the country at 2.0%, and the Toronto CMA fell 4.7% — national volumes down 1.1%. Add a provincial population that fell 152,648 over the twelve months to April. A thin pipeline plus flat sales per square foot is not a rent-growth engine; it is a floor under existing rents. Underwrite renewals at today’s rent, not at a trend line. For land, there is one live retail bid and it has a shape: grocery-anchored, pre-leased, value-oriented, on rooftops that already exist. 96% of daily-needs centres completed since 2022 are grocery anchored, and value-format grocers are now 52% of the pipeline against 38% a decade ago. In Alberta roughly 80% of the development pipeline is pre-leased. If a retail site cannot deliver an anchor lease before a shovel, it is not financeable in this market — which is exactly why so little is being built. Two practical plays. First, surplus parking at existing centres is the cheapest retail land in Ontario — the pad site at a tenanted centre needs no new trade area, and a ground lease to a quick-service or grocery user converts dead asphalt into income without a rezoning fight. That is the same “six acres of excess land” line in the Upper Canada Mall release. Second, on any residential land file in Halton, Durham or Niagara, the grocery commitment is the leading indicator — Costco and Fortinos follow building permits, not population projections. Where a national grocer has quietly tied up a corner, the rooftops are coming, and the land in behind it reprices. |
Sources
· Statistics Canada — The Daily, Retail trade, July 2026 (national sales -0.7% to $73.7 billion; volumes -1.1%; Ontario -2.0%; Toronto CMA -4.7%; August advance estimate +1.3%). https://www150.statcan.gc.ca/n1/daily-quotidien/260924/dq260924a-eng.htm
· Statistics Canada — Monthly retail trade sales by province and territory (Table 20-10-0056-01). https://www150.statcan.gc.ca/t1/tbl1/en/tv.action?pid=2010005601
· Retail Insider — “Canadian Retail Construction Hits Decade Low as Scarcity Reshapes Expansion,” October 2026, reporting JLL’s fall 2026 Retail Market Dynamics (pipeline, vacancy, rents, leasing, grocery-anchor shares by market). https://retail-insider.com/retail-insider/2026/10/canadian-retail-construction-decade-low/
· Connect CRE Canada — “Retail Pipeline Shrinks To 4.9M SF As Grocery Anchors Dominate” (national asking rent $32.43 per sq. ft.; rent growth slowing to 2.5%). https://www.connectcre.ca/stories/retail-pipeline-shrinks-to-4-9m-sf-as-grocery-anchors-dominate/
· CTV News — “Retailers face tougher search for space as construction drops to 10-year low: JLL,” October 2026. https://www.ctvnews.ca/business/real-estate/article/retailers-face-tougher-search-for-space-as-construction-drops-to-10-year-low-jll/
· JLL — Canada retail market dynamics (publisher page for the underlying report). https://www.jll.com/en-ca/insights/market-outlook/canada-retail
· Government of Ontario — Ontario Demographic Quarterly, first quarter 2026 (population down 152,648 over twelve months). https://www.ontario.ca/page/ontario-demographic-quarterly-highlights-first-quarter
Charts by Urban Land Group. Retail pipeline, vacancy and rent figures are brokerage data and are not official statistics; retail sales and population figures are from Statistics Canada and the Government of Ontario. Replacement-rate and residual-pipeline calculations are Urban Land Group arithmetic. General market commentary; not investment, financial, leasing or planning advice.