
The 17.3% Permit Drop Is Not a Housing Story
Three quarters of July’s decline was non-residential, and Ontario led it with a $1.1 billion fall in institutional permits. Residential fell less than a third of that. On a constant-dollar annual basis permits are down 2.2%. The pipeline’s problem is still conversion, not approval.
Urban Land Group · September 17, 2026
Statistics Canada reported that the total value of building permits issued in Canada fell $2.6 billion, or 17.3%, to $12.2 billion in July. The figure came in far below expectations and is being quoted as evidence of a housing slowdown, led by Ontario. Read the release and it is neither.
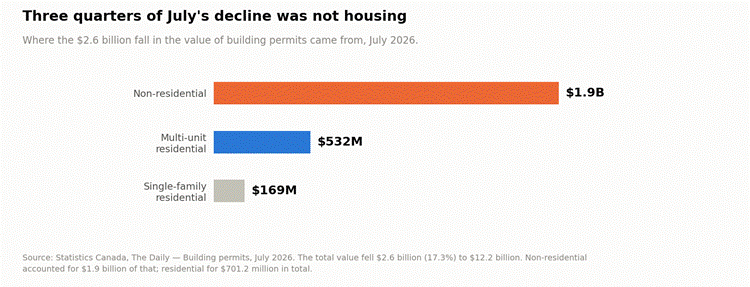
Figure 1 — Components of the July 2026 decline.
Non-residential accounted for $1.9 billion of the $2.6 billion fall, dropping to $5.0 billion. Residential fell $701.2 million in total, to $7.2 billion — of which multi-unit was $531.8 million and single-family $169.4 million. Ontario’s role in the headline was principally institutional: the province led that component with a $1.1 billion decrease.
Institutional permits are hospitals, schools, universities, courthouses and transit facilities. A billion-dollar swing in one province in one month is one or two large public projects crossing a reporting boundary. It is a lumpy series and it is not a read on the housing market.
The headline and the trend are different numbers
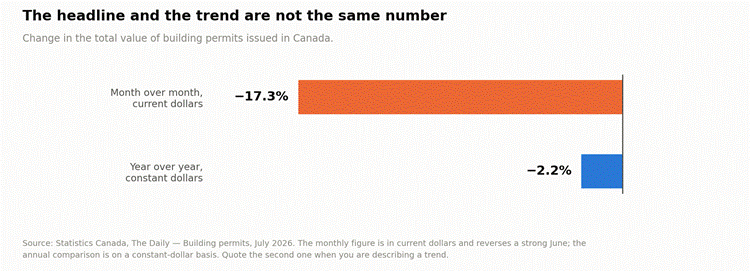
Figure 2 — Monthly headline against the annual trend.
The 17.3% is month over month in current dollars, reversing a strong June. On a constant-dollar basis against the same month last year, permits were down 2.2%. Those two numbers describe very different worlds, and only one of them is a trend.
What the release does confirm
19,200 multi-unit dwellings and 4,100 single-family dwellings were authorized in July. Over the past twelve months, 297,100 multi-unit dwellings were authorized, against 308,200 in the twelve months before. That is a soft multi-unit permit environment. It is not a collapsed one.
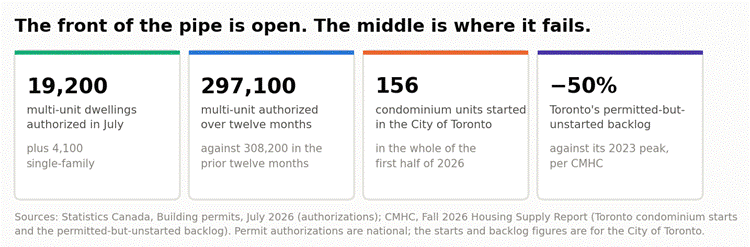
Figure 3 — Authorizations against what is actually starting.
Set that beside CMHC’s Fall report — 156 condominium units started in the City of Toronto in the first half of 2026, and a permitted-but-unstarted backlog down 50% from its 2023 peak — and the shape of the problem is unmistakable. Approvals are still being granted at roughly normal volumes. They are not converting into buildings, and in Toronto they are now expiring rather than accumulating.
And what the Bank actually said
The Governing Council’s deliberations for the September 2 decision are being summarised as confirming a downside bias to growth. They are more balanced than that, and the second half is the one being left out:
“Inflation risks had also increased… members agreed that the risk that inflation spreads to other goods and services had risen.” — Bank of Canada, Summary of Governing Council deliberations, September 2, 2026
The Council also recorded that housing activity had rebounded after an extended period of weakness, “despite continued softness in the condominium markets in Toronto and Vancouver.” Both halves belong in any note that cites this document.
| THE ULG VIEW Stop using 17.3% as a housing number. Three quarters of the fall was non-residential, and Ontario’s contribution was a $1.1 billion drop in institutional permits — a handful of very large public projects moving between months, not a market signal. If you are describing a trend to a client, the honest figure is the constant-dollar annual one: down 2.2%. What the release actually confirms is the conversion failure, and that is the more useful finding. 19,200 multi-unit dwellings were authorized in July, and 297,100 over twelve months against 308,200 in the prior twelve — soft, not collapsed. Permits are still being issued at close to normal volumes. Toronto started 156 condominium units in six months. The approval end of the pipeline is working. The financing end is not. That restores the argument we set out on September 4 and sharpens it. Entitlement is not the binding constraint; the pro forma is. What has changed is that in Toronto the unconverted permits are now lapsing rather than accumulating — approvals created at roughly normal rates, failing to convert, and expiring. So the scarce asset is not an approval. It is an approval attached to a product that can be financed today, which at present means rental. Anyone pricing entitlement generically — so much per approved door, regardless of tenure — is pricing the wrong thing, and will be on the wrong side of it. |
| TWO CORRECTIONS WORTH MAKING BEFORE THIS CIRCULATES On the permits. The 17.3% decline is being described as Ontario-led residential softness. Statistics Canada’s own release attributes the bulk of the fall to non-residential — $1.9 billion of the $2.6 billion — with Ontario leading the institutional component at $1.1 billion. Residential fell $701.2 million in total, of which multi-unit was $531.8 million. It is not a housing-permit collapse. On the Bank. The September 2 deliberations are being read as confirming a downside bias to growth. They are two-sided, and the hawkish half is explicit: “Inflation risks had also increased,” and members agreed that the risk of inflation spreading to other goods and services “had risen.” The Council also noted a rebound in housing activity, “despite continued softness in the condominium markets in Toronto and Vancouver.” On the gated reports. The Altus, Colliers and CBRE cap rate publications have not been opened for this note and no figure from any of them appears here. |
Sources
· Statistics Canada — The Daily, Building permits, July 2026. https://www150.statcan.gc.ca/n1/daily-quotidien/260916/dq260916a-eng.htm
· Bank of Canada — Summary of Governing Council deliberations, fixed announcement date of September 2, 2026. https://www.bankofcanada.ca/2026/09/summary-of-governing-council-deliberations-fixed-announcement-date-of-september-2-2026/
· Bank of Canada — rate announcement and statement, September 2, 2026. https://www.bankofcanada.ca/2026/09/fad-press-release-2026-09-02/
· CMHC — Fall 2026 Housing Supply Report. https://www.cmhc-schl.gc.ca/professionals/housing-markets-data-and-research/market-reports/housing-market/housing-supply-report
Charts by Urban Land Group from the Statistics Canada, Bank of Canada and CMHC sources listed above. Permit figures are as published and are subject to revision; monthly permit values are not seasonally comparable to annual constant-dollar changes and are labelled accordingly. General market commentary; not investment, financial or planning advice.