
CMHC’s July figures show the approved-but-unstarted backlog rising while actual urban starts fell 19% year over year. Toronto’s starts are at their lowest level since 2009 — below Calgary, Montréal and Vancouver for the first time.
Urban Land Group · September 4, 2026
CMHC reported that the national annualized rate of housing starts fell 5% in July, to 229,074 units. That is the number that got quoted. It is not the interesting one.
Further down the same release is a line that matters far more to anyone pricing land: units with approved permits but not yet started rose 3% in a single month, to 141,480. In June the figure was 137,324. The backlog of homes that governments have already said yes to, and that nobody has begun to build, is growing.
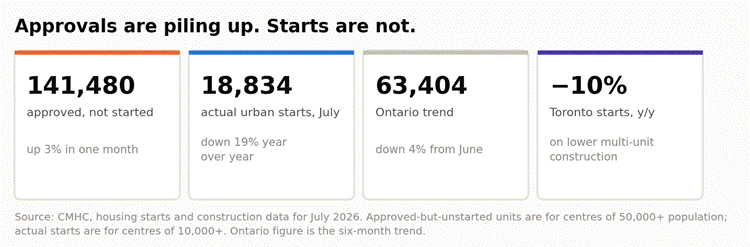
Figure 1 — CMHC housing starts and construction data, July 2026.
Two numbers that should not move in the same direction
Actual starts in centres of 10,000 or more were 18,834 units in July, down 19% from 23,155 in July 2025. Ontario’s six-month trend fell 4% from June, to 63,404 units. Toronto starts were down 10% year over year on lower multi-unit construction.
Permits are being issued into a market that is not converting them. That is a different problem from the one Ontario housing policy has been solving for the past four years.
This is a pro forma problem, not a planning problem
Almost every provincial housing instrument since 2022 has been aimed at the approval: application timelines, appeal rights, as-of-right permissions, standardized designs. Those were reasonable responses to the constraint as it stood. The July data says the constraint has moved.
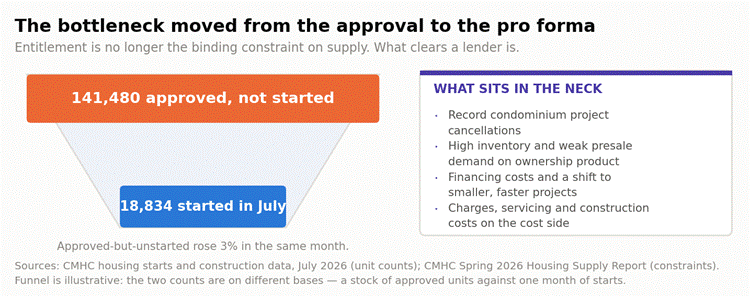
Figure 2 — Where approved units are stalling, and what CMHC identifies as the cause.
CMHC’s own Spring 2026 Housing Supply Report names the causes and none of them is a zoning by-law: record condominium project cancellations, high inventory against weak presale demand, financing costs, and a shift toward smaller projects that require a lower commitment. Add development charges, servicing and construction cost inflation on the cost side and you have a pipeline that is approved, capitalised at 2021 assumptions, and unbuildable at 2026 ones.
And the approved product is not the product being built
The tenure mix has inverted. Condominium apartments fell from nearly one third of Toronto starts in 2023 to about 10% in 2025. Over the same period purpose-built rental starts reached their second-highest level since 1990 and surpassed condominium starts in Toronto for the first time.
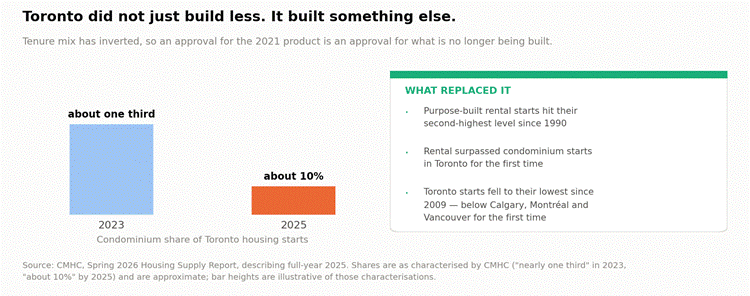
Figure 3 — Toronto’s tenure mix, per CMHC’s Spring 2026 Housing Supply Report.
A site entitled as a condominium tower in 2021 or 2022 therefore holds an approval for the product that has stopped clearing. The zoning is real. The absorption behind it is not the absorption that was underwritten.
| THE ULG VIEW The GTA land trade has run on one assumption for twenty years: buy raw or under-zoned, carry it through the approval, sell it entitled at a premium. The premium was never really for the paper. It was for the near-certainty that the paper converts into a building. A backlog of 141,480 approved-and-unstarted units is the market repricing that conversion. If you hold entitled land and the pro forma does not clear today, you do not own a shovel-ready site. You own an option on construction costs, rates and absorption — and you are paying carry to hold it. On acquisitions: stop paying a full entitlement premium for an approval whose product is condominium. Underwrite the site on the tenure that is actually being financed. Rental starts overtook condominium starts in Toronto for the first time, which is where lenders and CMHC MLI Select are pointing, and a re-tenured pro forma is worth more than a stale approval. On dispositions: “it’s approved” is a materially weaker argument in 2026 than it was in 2022. The buyer is not underwriting the approval. The buyer is underwriting the start. Bring a costed, financeable scheme to the table, or expect the entitlement to be discounted rather than paid for. |
| A NOTE ON THE TWO NUMBERS The two figures in the funnel at Figure 2 sit on different bases and are deliberately not presented as a conversion rate. 141,480 is a stock of approved-but-unstarted units across centres of 50,000 or more population. 18,834 is a single month of actual starts across centres of 10,000 or more. The comparison shows direction — a backlog rising while starts fall — not a percentage. Anyone quoting a ratio between the two is inventing it. |
Sources
· CMHC — Housing starts and construction data for July 2026. https://www.cmhc-schl.gc.ca/media-newsroom/news-releases/2026/housing-starts-construction-data-july-2026
· CMHC — Housing starts and construction data for June 2026 (prior-month backlog figure). https://www.cmhc-schl.gc.ca/media-newsroom/news-releases/2026/housing-starts-june-2026
· CMHC — Spring 2026 Housing Supply Report (Toronto tenure mix and construction constraints). https://www.cmhc-schl.gc.ca/professionals/housing-markets-data-and-research/market-reports/housing-market/housing-supply-report
Charts by Urban Land Group from the CMHC releases and report listed above. Figures are as published by CMHC and are subject to revision. General market commentary; not investment, financial or planning advice.