
National CPI rose to 3.0% in July on gasoline alone. Ontario did not move — held at 2.0% by a 4.6% fall in the cost of replacing a house.
Urban Land Group, August 18, 2026
Statistics Canada released the July Consumer Price Index this morning. The national rate rose to 3.0% year over year, up from 2.8% in June. Ontario did not move: 2.0%, unchanged from June, and the lowest reading of any province.
Those are two different economies inside one monetary policy.
The national number is a gasoline number
Gasoline prices were up 25.7% year over year in July, after 20.5% in June, on conflict in the Middle East including the blockade of the Strait of Hormuz. Strip gasoline out and the CPI was 2.2% — the third consecutive month at exactly that level. CPI-trim, one of the Bank of Canada’s core measures, was 1.9%. CPI-median was 2.0%.
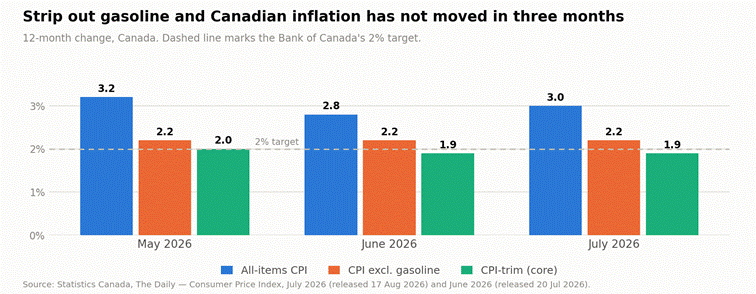
Figure 1 — The headline moves with oil. Everything built to see through oil does not.
It is also worth being careful with the word acceleration. The national rate was 3.2% in May, 2.8% in June and 3.0% in July. That is not a trend; it is a single volatile input moving through a fixed basket while the rest of the basket stands still.
Ontario is the outlier, not the average
At 2.0%, Ontario sits a full point below the national rate and 0.9 points below British Columbia, the next-softest province. The spread between Ontario and Nova Scotia, at 5.0%, is three percentage points — an unusually wide dispersion for a single currency area.
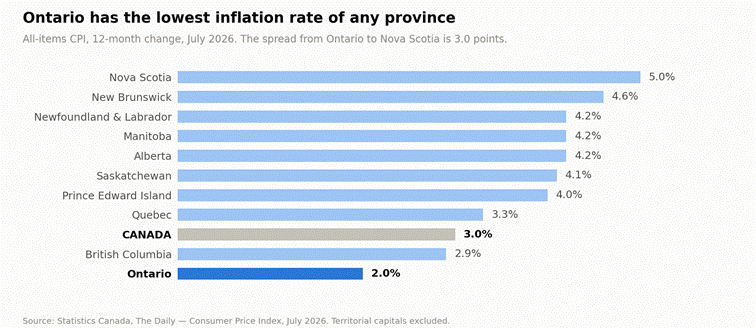
Figure 2 — All-items CPI by province, 12-month change, July 2026.
What is holding Ontario down
Statistics Canada is specific about the cause:
“Ontario was unchanged at 2.0% in July compared with June (+2.0%). This was the smallest price increase among the provinces, stemming from declines in homeowners’ replacement cost (−4.6%) and prices for natural gas (−18.7%).” — The Daily, 17 August 2026
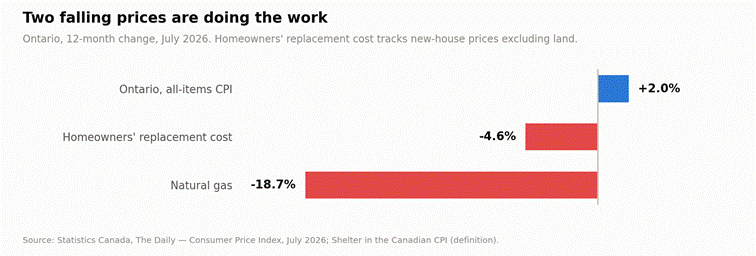
Figure 3 — Ontario’s two largest downward contributors, 12-month change, July 2026.
Homeowners’ replacement cost is worth understanding precisely, because it is the one line in the CPI that speaks directly to development economics — and it is routinely misread as a house price. It is not. It measures the depreciation of the owned housing stock, and its monthly movement is driven by a version of the New Housing Price Index that excludes land — what Statistics Canada calls the “house only” index.
So −4.6% is a statement about what builders are realizing on the structure, not about what serviced lots are trading for. That cuts both ways. It means the figure is not a direct read on land values. It also means it is a cleaner read on the revenue side of a residual land value calculation than any blended house-price index would be.
The September 2 decision
The Bank of Canada held its policy rate at 2.25% on July 15 and next announces on September 2. Its July statement noted that measures of core inflation “remained close to 2%” and projected CPI returning to around 2% in early 2027.
The common reading — that a 3.0% headline closes the door on a September cut — is not as clean as it sounds. The headline is above target; every measure the Bank built to see through supply shocks is at or below it. What a 3.0% print raises is the political cost of cutting, not the economic case against it. But the practical conclusion for a landowner is the same either way: do not underwrite the cut.
| THE ULG VIEW For anyone running a residual land value model in the GTA, Halton or Hamilton, the −4.6% is the line that matters, and it points one way. Land is the last term in the equation: when the revenue side softens and hard costs do not follow, the residual absorbs the difference. Hold pro-forma revenue flat rather than escalating it, and do not build a September rate cut into your carry. Ontario’s low inflation reading is not a sign of a healthy market. It is, in part, a measurement of a new-build sector that cannot raise prices. |
Sources
· Statistics Canada, The Daily — Consumer Price Index, July 2026 (17 Aug 2026). https://www150.statcan.gc.ca/n1/daily-quotidien/260817/dq260817a-eng.htm
· Statistics Canada, The Daily — Consumer Price Index, June 2026 (20 Jul 2026). https://www150.statcan.gc.ca/n1/daily-quotidien/260720/dq260720a-eng.htm
· Statistics Canada, Shelter in the Canadian CPI: An overview, 2023 update. https://www150.statcan.gc.ca/n1/pub/62f0014m/62f0014m2023007-eng.htm
· Bank of Canada, policy rate announcement, 15 July 2026. https://www.bankofcanada.ca/2026/07/fad-press-release-2026-07-15/
· Bank of Canada, 2026 schedule of policy interest rate announcements. https://www.bankofcanada.ca/2025/08/bank-canada-publishes-2026-schedule-policy-interest-rate-announcements-other-major-publications/
Charts by Urban Land Group from Statistics Canada data. General market commentary; not investment, planning or financial advice.