
Brampton’s Tax Arrears Jumped 36% in a Year.
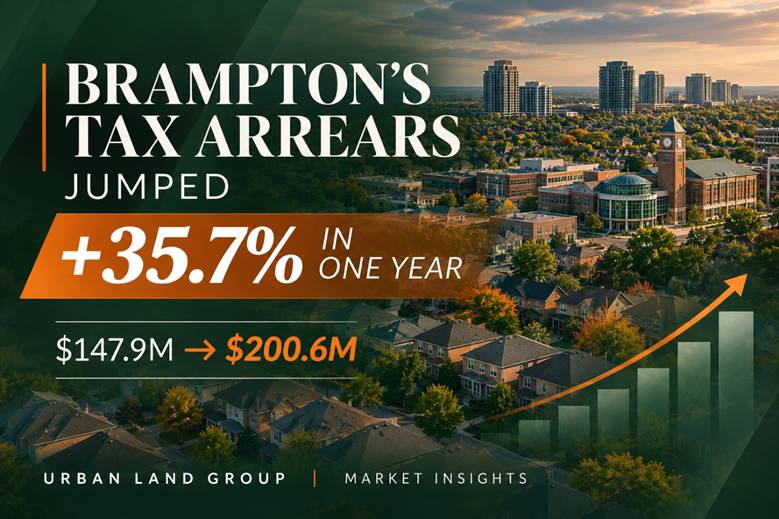
The city’s own auditors confirm the direction. The 11.9% figure is not what it is being called and almost none of it is reaching a tax sale
November 16, 2026
A piece circulating this week reports that Ontario property tax arrears have hit a 24-year high, with Brampton leading at 11.9%. Before dismissing it or repeating it, we checked the City of Brampton’s audited statements. The underlying movement is real and it is big. Taxes receivable rose from $147.9 million to $200.6 million in a single year — up 35.7% — while the city’s tax levy rose 8.1%. That is a genuine signal, and the coverage deserves credit for finding it.
Three things about the 11.9% are worth getting right before anyone writes it off.
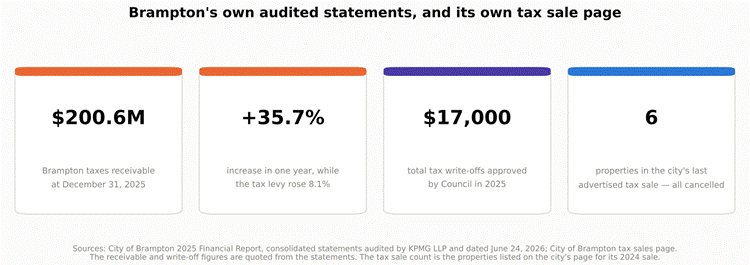
Figure 1. Brampton’s own audited numbers, and its own tax sale record.
The rise is real
The City of Brampton’s 2025 Financial Report, audited by KPMG and dated June 24, 2026, shows taxes receivable of $200,603 thousand at December 31, 2025 against $147,875 thousand a year earlier. Property taxation revenue over the same period went from $578,273 thousand to $625,261 thousand.
So the receivable grew more than four times faster than the levy. Whatever you call the ratio, a balance that jumps 36% in a year while billings rise 8% is telling you something. Nothing below is an argument that the story is wrong.
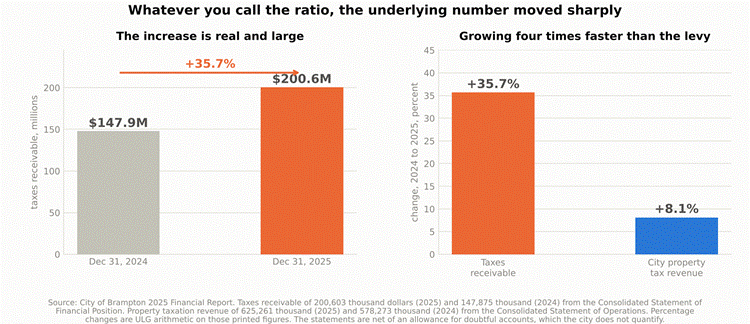
Figure 2. The movement the article found, in Brampton’s own audited figures.
First: “arrears” is not a line in the filing
The data behind these figures is the Financial Information Return every Ontario municipality files with the province. Schedule 70 has no line called arrears. It reports taxes receivable broken down by the year the tax was levied: line 0610 current year’s levies, line 0620 previous year’s levies, line 0630 “two or more years previous to the current reporting year”, line 0640 penalties and interest, less line 0690 for uncollectibles.
Only line 0630 unambiguously means long-standing arrears. Line 0610 is the current year’s receivable at December 31 — which includes amounts in payment arrangements, supplementary and omitted assessments billed late in the year, and ordinary collection lag. Adding all of it together and calling the total “delinquent” overstates what the number proves.
We checked the most obvious innocent explanation and it does not rescue Brampton. The city’s final regular instalment falls on September 23 for residential and October 21 for commercial, industrial and multi-residential. By December 31 every regular instalment is past due. So billing timing is not the story here — which makes the increase harder to explain away, not easier.
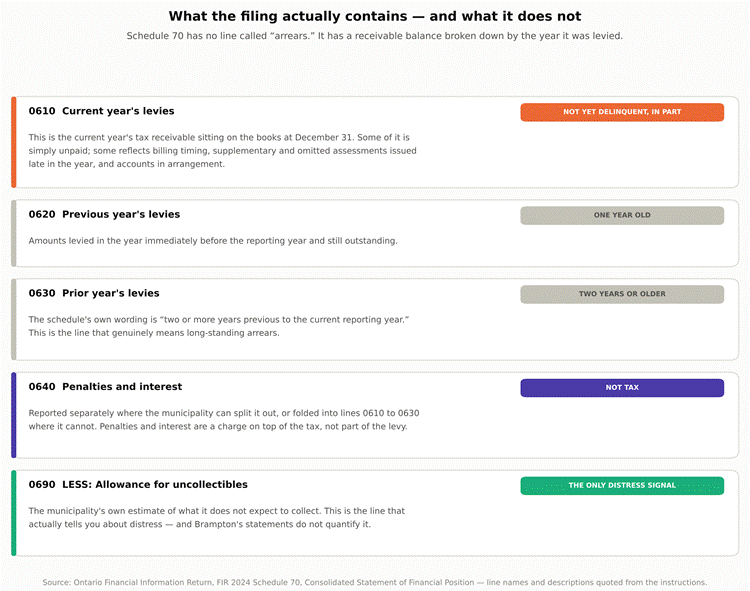
Figure 3. The actual line items, quoted from Ontario’s Schedule 70 instructions.
Second: the ratio divides a multi-year balance by one year of levy
Taxes receivable is a balance at a point in time that accumulates across years. A levy is one year of billing. Dividing the first by the second does not give “the share of each year’s levy that was still unpaid at year’s end”, which is how the article describes it. It gives a stock-to-flow ratio that rises whenever collections lag, regardless of how old the balance is.
The denominator is worth noticing too. Brampton’s statements expressly exclude Region of Peel and school board taxation — the city bills those but does not keep them. Against the City’s own $625.3 million of tax revenue, the $200.6 million receivable is 32%. To get to 11.9% the denominator has to be roughly $1.69 billion, which is the full levy including the Region and the school boards. Both numbers are defensible; they are just answering different questions, and only one of them gets quoted.
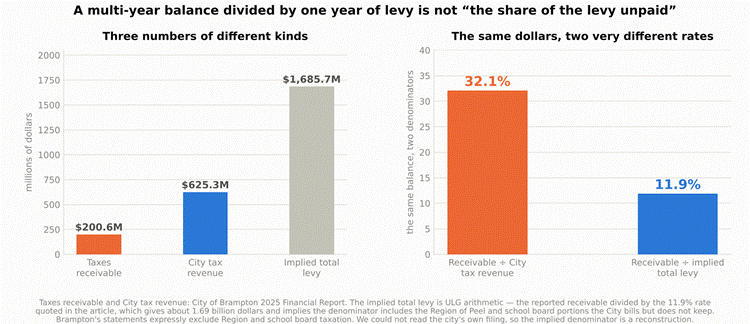
Figure 4. The same dollars against two denominators. The 11.9% requires the full levy, not the city’s own.
Third, and most relevant for land: nothing is reaching a tax sale
This is the part that matters if you are looking at distressed acquisition. Against a $200.6 million receivable, Brampton’s Council approved $17 thousand of write-offs in all of 2025 — 0.008% of the balance. Note 3 states there were no write-offs at all related to section 354 of the Municipal Act, 2001.
And the city’s own tax sales page shows a 2024 sale listing six properties, with a cancellation notice against all six, and no current sale advertised. Six properties. In a city carrying a nine-figure receivable.
Brampton describes its own process this way: a tax arrears certificate may be registered where arrears are owing on January 1 of the second year after the taxes became owing; the property may then be sold by public tender if the cancellation price is not paid within one year; partial payments are not accepted after registration except under an extension agreement approved by the Treasurer; and a sale declared unsuccessful may be vested in the municipality or re-advertised within two calendar years.
The pipeline exists. Almost nothing is in it. If your thesis is that rising arrears will produce a supply of distressed land, the enforcement data says that is not happening yet — and a municipality writing off 0.008% of its receivable is signalling it expects to collect, not that it has given up.
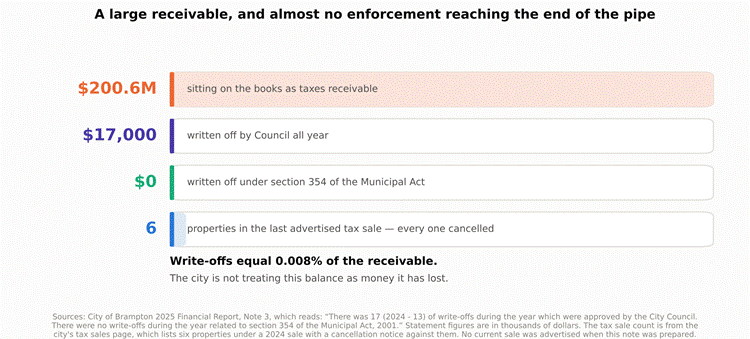
Figure 5. The receivable, the write-offs and the tax sales, side by side.
A note on the province-wide claim
The 7.2% provincial figure rests on 316 of 414 municipalities that filed for 2025, against 392 up to date for 2024, with Hamilton’s filings unavailable for both. A 24-year comparison where the sample changes by 76 filers between the two most recent years is not like for like. The article is transparent about this, to its credit — but the “highest since 2001” framing carries more precision than a shifting sample supports.
A smaller point: the article gives $2.43 billion against $34.1 billion in levies, which divides to 7.13%, not the 7.2% it reports. Probably rounding. Worth knowing if you are quoting the figure.
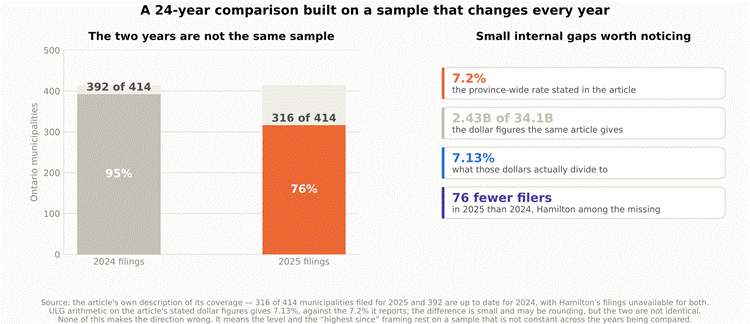
Figure 6. The coverage behind the provincial number, and a small internal inconsistency.
| THE ULG VIEW Take the signal seriously and the metric loosely. A 36% jump in a receivable against an 8% levy increase, in Brampton specifically, lines up with everything else we have seen about that market this year — and the billing-timing explanation does not hold, because every regular instalment is past due by December 31. Something is genuinely deteriorating in household and owner cash flow there. But do not treat 11.9% as a delinquency rate. It is a multi-year receivable balance divided by one year’s full levy including Region and school board portions. The comparable figure against the City’s own revenue is 32%, and neither number separates a bill that is thirty days late from one that is three years old. The line that would actually tell you about distress is the allowance for uncollectibles, and Brampton does not quantify it. For anyone watching for distressed land, the enforcement data is the answer and it is clear: 17 thousand dollars of write-offs, no section 354 write-offs at all, and six properties in the last advertised tax sale, all cancelled. There is no wave of tax-sale inventory coming out of this. Municipal tax sales in Ontario remain a slow, thin and heavily procedural channel, and arrears rising does not change that in the near term. What would change our view: the allowance for uncollectibles being disclosed and rising, line 0630 growing as a share of the receivable, or the city actually registering certificates at scale. Watch those three. The headline ratio tells you much less than any of them. |
| WHAT IS CONFIRMED AND WHAT IS NOT Confirmed from primary sources. Taxes receivable, property taxation revenue, the write-off figures and the section 354 statement are quoted from the City of Brampton 2025 Financial Report, consolidated statements audited by KPMG LLP and dated June 24, 2026. The Schedule 70 line names and descriptions are quoted from Ontario’s FIR 2024 Schedule 70 instructions. The instalment due dates are from the City of Brampton’s tax due dates page. All percentage changes are ULG arithmetic on those printed figures. Not confirmed. We did not read Brampton’s own Financial Information Return filing, so we could not reproduce the 11.9% directly. The implied total levy of about $1.69 billion is a reconstruction, derived by dividing the reported receivable by the quoted rate. The Schedule 70 instructions we read are the 2024 edition; the article’s data is 2025 and the instructions may differ. Could not be read. Ontario’s e-Laws site serves a JavaScript shell to automated requests and CanLII blocks them, so we could not read Part XI of the Municipal Act, 2001 directly. The tax sale process described here is the City of Brampton’s own description of its process on its tax sales page, not statutory text. Verify the statutory timelines and the cancellation price definition with a lawyer before acting on them. Brampton’s tax sales page also carries a 2023 copyright notice and may not be current. A caution on the allowance. Note 3 states the amounts are net of an allowance for doubtful accounts estimated by management, but the statements do not disclose the amount. The receivable figures above are therefore already net of an undisclosed reserve, which means the gross balance is larger than $200.6 million by an amount we cannot determine. The article is trade press, not an official source. Its data is described only as “filings with the Government of Ontario.” It does not name the Financial Information Return or the Ontario Data Catalogue, and we have not reproduced its province-wide series. |
Sources
Official and primary sources
· City of Brampton, 2025 Financial Report (consolidated financial statements, audited by KPMG LLP, June 24, 2026). https://www.brampton.ca/EN/City-Hall/Annual-Report/Documents/2025_Financial_Report.pdf
· City of Brampton, Annual Report and financial statements index. https://www.brampton.ca/EN/City-Hall/Annual-Report/Pages/AnnualReport.aspx
· City of Brampton, Tax Sales. https://www.brampton.ca/EN/residents/Taxes-Assessment/taxation/Pages/tax-sales.aspx
· City of Brampton, Tax Due Dates. https://www.brampton.ca/EN/residents/Taxes-Assessment/taxation/Pages/Tax-Due-Dates.aspx
· Ontario, Financial Information Return — FIR 2024 Schedule 70, Consolidated Statement of Financial Position (instructions). https://efis.fma.csc.gov.on.ca/fir/wp-content/uploads/fir-files/municipal-reporting/fir-instructions/2024/FIR2024%20S70.pdf
· Ontario Data Catalogue, Municipal financial information (Financial Information Return data). https://data.ontario.ca/dataset/municipal-financial-information
· Ontario, Municipal Act, 2001 (e-Laws; Part XI governs sale of land for tax arrears — not machine-readable at time of writing). https://www.ontario.ca/laws/statute/01m25
Trade press (not official)
· Better Dwelling, “Ontario Property Tax Arrears Hit 24-Year High, Brampton Leads At 11.9%”, November 13, 2026 — the article this note responds to. https://betterdwelling.com/ontario-property-tax-arrears-hit-24-year-high-brampton-leads-at-11-9/
Sunny Gawri
Urban Land Group — land development advisory and commercial brokerage
Sales Representative, Royal LePage Signature Realty, Brokerage — registered in Ontario since 2013
30 Eglinton Avenue West, Mississauga, Ontario
This note is general market commentary compiled from public sources. It is not an appraisal, not a legal opinion, and not tax advice. Figures described as ULG calculations are our own arithmetic on the cited public data. Municipal tax sale procedure is governed by statute and regulation and turns on facts specific to each property; obtain advice from a lawyer before pursuing any property in arrears.