
Does Immigration Policy Just Double Population Growth?
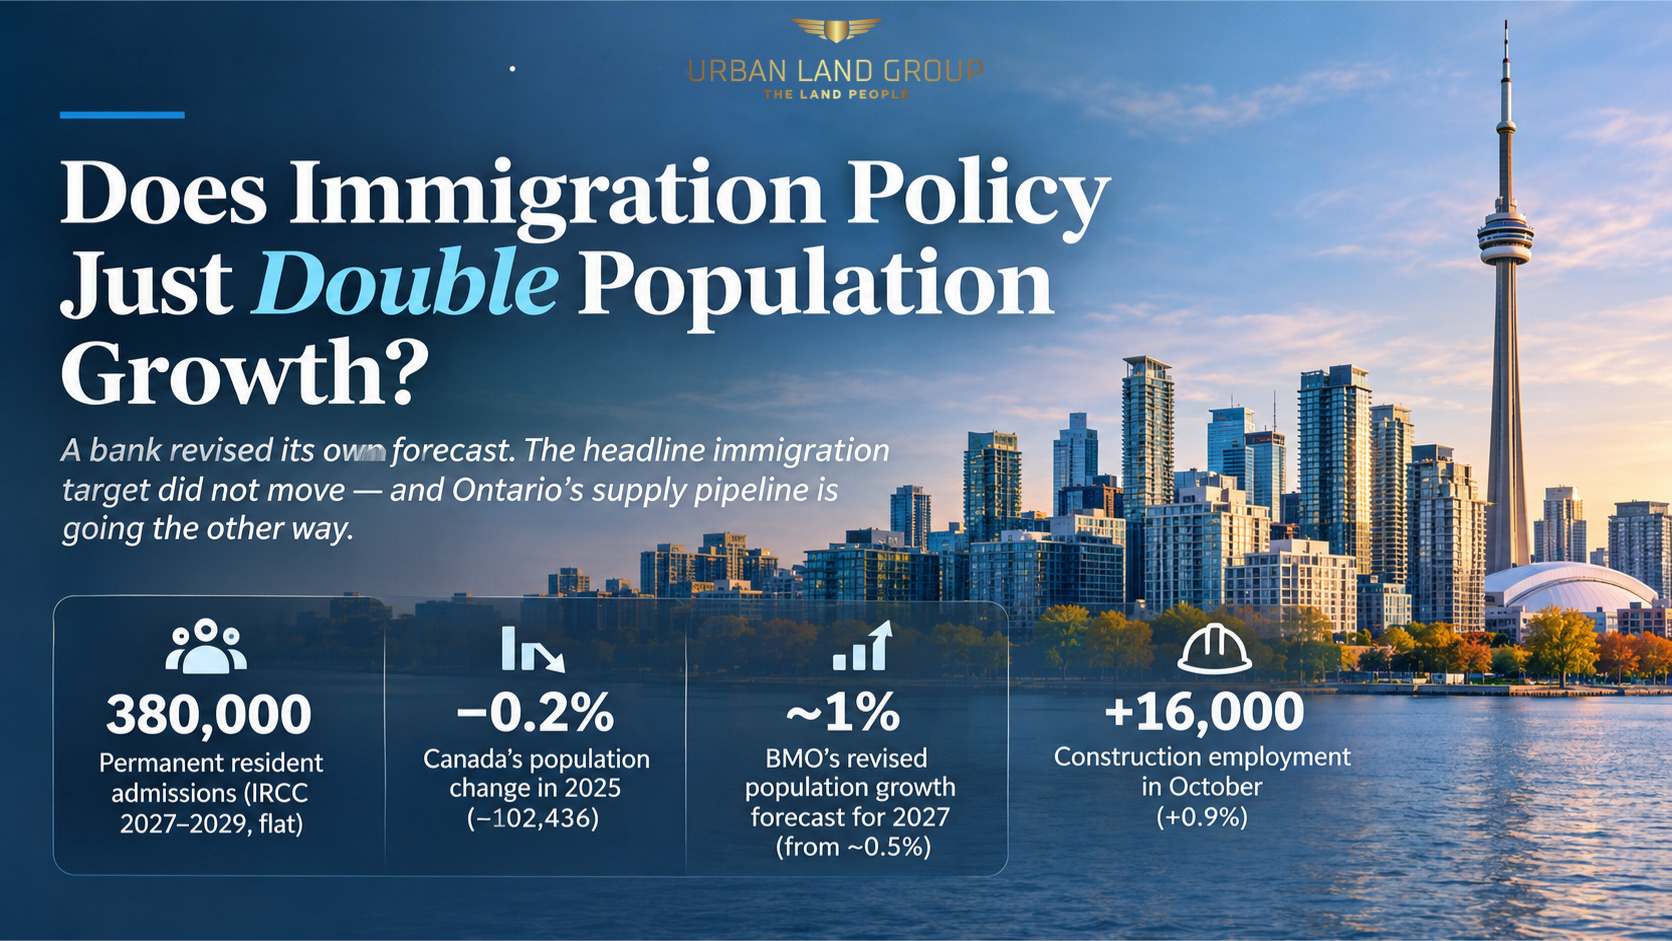
A bank revised its own forecast. The headline immigration target did not move — and Ontario’s supply pipeline is going the other way
November 12, 2026
A widely shared piece this week carries the headline “Canadian Immigration Changes To Double Population Growth Rate: BMO”, under the line “How else would Canada fill the 110,000 jobs lost in the past two months?” Both halves need unpacking before anyone underwrites land on the back of them.
The underlying story is real: Ottawa has introduced a measure that could keep temporary residents in the country rather than letting them leave, and that changes the population arithmetic materially. But the “doubling” is a bank revising its own forecast, the headline immigration target did not move at all, and the jobs number is not the two most recent months.
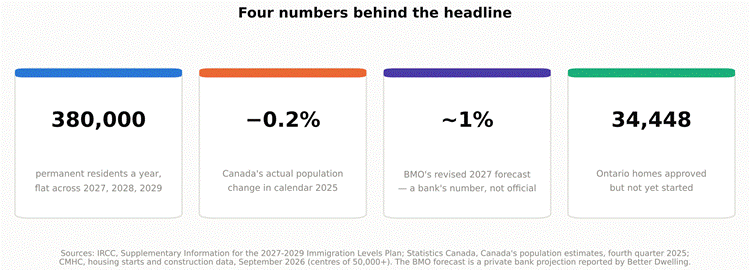
Figure 1. Four numbers that sit underneath the headline, three of them official.
The jobs figure is August and September
Statistics Canada’s Labour Force Survey recorded employment declines of 42,000 in August and 68,000 in September. That is the 110,000. The October release, published November 6, reported employment “little changed” at −4,700. So at the time the article ran on November 10, the two most recent months summed to roughly −72,700, not 110,000.
More to the point for anyone in land: the losses were not in construction. Construction employment rose 16,000 (+0.9%) in October and is up 47,000 (+2.9%) over twelve months. The declines were concentrated in the public sector, which shed 148,000 over four consecutive months to September before rebounding 50,000 in October, and in Quebec, which lost 68,000 across August and September alone. Ontario employment was “little changed for a third consecutive month” in October.
The one Ontario signal worth keeping: the province’s unemployment rate rose 0.3 points to 7.3% in October, against a national rate of 6.7%. Ontario is not shedding jobs, but it is absorbing new entrants more slowly than the country.
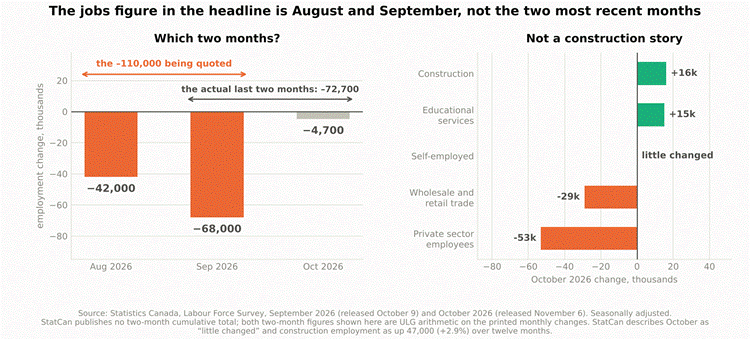
Figure 2. The quoted figure, the actual figure, and where October’s movement really was.
What “double” actually means here
BMO moved its 2027 population growth forecast from about 0.5% to about 1%. That is a doubling of a private bank’s own projection. It is not a doubling of the current growth rate, and Statistics Canada publishes no forecast of this kind at all.
The context that matters is the base. Canada’s population fell by 102,436 people (−0.2%) across calendar 2025, on StatCan’s preliminary estimates. The non-permanent resident population peaked at 3,149,131 on October 1, 2024 and stood at 2,779,774 on July 1, 2026. Against that, a 1% year is a genuine turn in direction — but a single quarter of late 2023 added 256,804 people (+0.6%), more than BMO now expects from the whole of 2027.
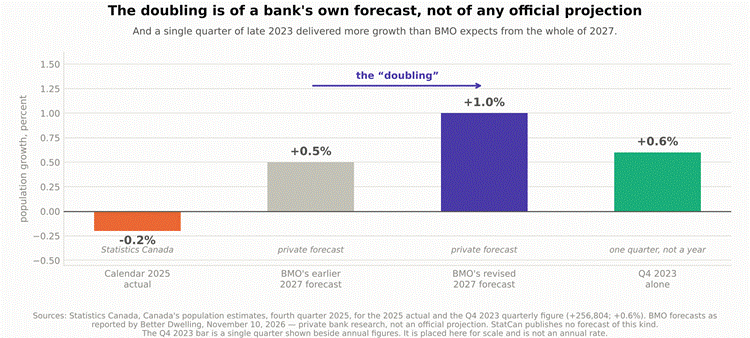
Figure 3. The doubling, placed beside what actually happened.
Ontario’s own numbers
Ontario’s population declined 0.3% in Q4 2025 and 0.2% in Q1 2026, then rose 0.1% in Q2 2026 to 16,262,121. The driver is visible in one series: Ontario’s non-permanent resident population fell 6.4%, then 4.4%, then 1.5% across those same three quarters. The drain is decelerating sharply. It has not reversed.
That deceleration, not the levels plan, is what would mechanically lift measured growth first. If people who were expected to leave simply stop leaving, growth rises without a single additional admission.
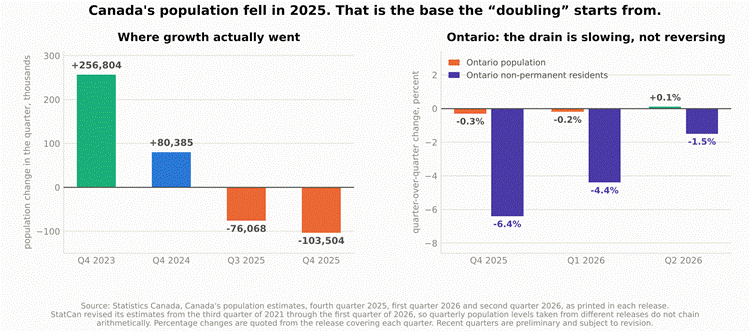
Figure 4. The national picture and the Ontario one. Note the vintage caution in the source line.
What IRCC actually published
The 2027–2029 Immigration Levels Plan, issued November 5, holds permanent resident admissions at 380,000 for all three years — flat, not increased — within a range of 352,500 to 422,000. New temporary resident arrivals are set at 370,000 a year: 220,000 workers and 150,000 students. The 2028 and 2029 figures are described as notional, to be confirmed or adjusted by November 1 next year.
The plan does introduce “a new time-limited measure to provide additional space to process permanent residence applications in 2027”, with a workers cohort and a humanitarian cohort. IRCC attaches no number to it. The only in-Canada transition figures the department publishes are Budget 2025 initiatives covering up to 115,000 Protected Persons in Canada and 33,000 work permit holders — and those span 2026 and 2027 together.
BMO’s figure of “roughly 280,000 temporary residents … on top of new admissions”, and the resulting “closer to 660,000 permanent residents”, cannot be reconciled with what IRCC has published. The department does not state whether in-Canada transitions sit inside or on top of the 380,000. That single unanswered question is the hinge the entire forecast turns on. If they sit inside it, the headline number is unchanged and so is the demand picture.
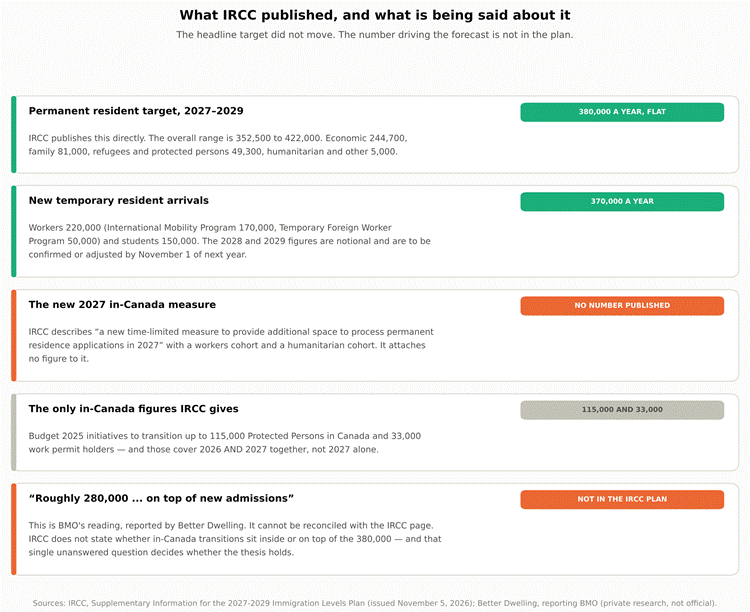
Figure 5. The published plan line by line, against the figure driving the forecast.
The side of this that is already measurable
While the demand side is a forecast, the supply side is data. CMHC’s September release shows Ontario units approved but not yet started rising 7.6% in a single month to 34,448, while units under construction fell 2.5% to 145,608. In the Toronto CMA, units under construction fell 3.8% to 88,108 and CMHC described the Toronto starts trend as flat.
Year to date through September, Ontario starts in centres of 10,000 or more were 43,994 against 46,111 a year earlier, down 5% — with single-detached up 1% and everything else down 6%. Permits are being issued and not acted on. That is the definition of a pipeline backing up.
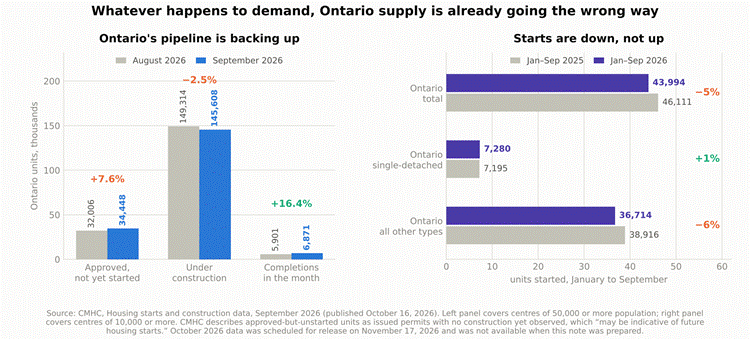
Figure 6. Ontario’s pipeline and starts, from CMHC’s September data.
| THE ULG VIEW The demand thesis is plausible and the direction is probably right. Retaining temporary residents who were otherwise expected to leave would lift measured population growth faster than any change to admission targets, because it removes a subtraction rather than adding an addition. That is a real mechanism. But nothing in this is an announced increase in immigration. The permanent resident target is flat at 380,000 for three straight years. The number doing the work in BMO’s forecast is not in IRCC’s published plan, and IRCC has not said whether in-Canada transitions are counted inside the headline target. Underwriting absorption on a 660,000 figure means betting on an interpretation the department has not confirmed. For land, the more actionable fact is on the other side of the ledger. Ontario has 34,448 approved-but-unstarted units and that number grew 7.6% in a month while units under construction fell. Entitlements are not converting to starts. Whatever happens to population, the constraint on delivery right now is cost of capital and feasibility, not permission. The practical read: a demand recovery that arrives in 2027 meets a supply pipeline that is stalling in 2026. That is constructive for entitled, shovel-ready land held by someone who can carry it — and it is a serious problem for anyone whose model needed starts to begin this year. |
| WHAT IS CONFIRMED AND WHAT IS NOT Confirmed from primary sources. All employment figures are quoted from Statistics Canada’s Labour Force Survey releases for September 2026 (October 9) and October 2026 (November 6), seasonally adjusted. All population figures are quoted from StatCan’s quarterly population estimates for Q4 2025, Q1 2026 and Q2 2026. All immigration targets are quoted from IRCC’s Supplementary Information for the 2027-2029 Immigration Levels Plan, issued November 5, 2026. All housing figures are from CMHC’s housing starts and construction data for September 2026, published October 16, 2026. Not official. The BMO forecast, the 280,000 figure and the 660,000 figure reach us through Better Dwelling’s reporting of a bank’s research note. We did not read BMO’s note itself. These are private projections and should not be treated as government numbers. A real data caution. StatCan revised its population estimates from Q3 2021 through Q1 2026. Quarterly population levels taken from different releases therefore do not chain arithmetically — subtracting the Q1 level from the Q2 level implies 0.9% growth where StatCan reports 0.2%. Any growth rate computed across vintages will be wrong. Figures here are quoted from the release covering each quarter rather than derived. Two-month employment totals are our arithmetic. StatCan does not publish a two-month cumulative employment change. Both the −110,000 and the −72,700 are sums of the printed monthly figures. Gaps. CMHC’s October housing data was scheduled for November 17, 2026 and was not available. No Q3 2026 population estimate has been released. Ontario’s monthly seasonally adjusted starts rate was not retrievable, so year-to-date and trend figures are used instead. We did not use CMHC’s Ontario or Toronto single-month actual start counts, which we could not verify against the published tables. Recent quarters are preliminary. StatCan states its recent population estimates are preliminary and notes that a reported decrease “could be smaller, or greater, or even turn into an increase” after revision. |
Sources
Official and primary sources
· IRCC, Supplementary Information for the 2027-2029 Immigration Levels Plan (issued November 5, 2026). https://www.canada.ca/en/immigration-refugees-citizenship/corporate/immigration-system/levels/supplementary-immigration-levels-2027-2029.html
· Statistics Canada, Labour Force Survey, October 2026 (released November 6, 2026). https://www150.statcan.gc.ca/n1/daily-quotidien/261106/dq261106a-eng.htm
· Statistics Canada, Labour Force Survey, September 2026 (released October 9, 2026). https://www150.statcan.gc.ca/n1/daily-quotidien/261009/dq261009a-eng.htm
· Statistics Canada, Canada’s population estimates, second quarter 2026 (released September 23, 2026). https://www150.statcan.gc.ca/n1/daily-quotidien/260923/dq260923b-eng.htm
· Statistics Canada, Canada’s population estimates, first quarter 2026 (released June 17, 2026). https://www150.statcan.gc.ca/n1/daily-quotidien/260617/dq260617a-eng.htm
· Statistics Canada, Canada’s population estimates, fourth quarter 2025 (released March 18, 2026). https://www150.statcan.gc.ca/n1/daily-quotidien/260318/dq260318b-eng.htm
· CMHC, Housing starts and construction data, September 2026 (published October 16, 2026). https://www.cmhc-schl.gc.ca/media-newsroom/news-releases/2026/housing-starts-construction-data-september-2026
Private research and trade press (not official)
· Better Dwelling, “Canadian Immigration Changes To Double Population Growth Rate: BMO”, November 10, 2026 — reporting BMO research, which we did not read directly. https://betterdwelling.com/canadian-immigration-changes-to-double-population-growth-rate-bmo/
Sunny Gawri
Urban Land Group — land development advisory and commercial brokerage
Sales Representative, Royal LePage Signature Realty, Brokerage — registered in Ontario since 2013
30 Eglinton Avenue West, Mississauga, Ontario
This note is general market commentary compiled from public sources. It is not an appraisal, not a legal opinion, and not advice on any specific property. Figures described as ULG calculations are our own arithmetic on the cited public data. Population and employment estimates are preliminary and subject to revision by the issuing agency. Confirm all assumptions with the primary source before relying on them.