
Rents Rose $7 Nationally. In Toronto They Fell 2.1% For Anyone Signing a New Lease.

The headline number is the average of two opposite trends. Which one applies to your building depends entirely on how often tenants move — and on a date in 2018.
November 2, 2026 · Sunny Gawri, Urban Land Group
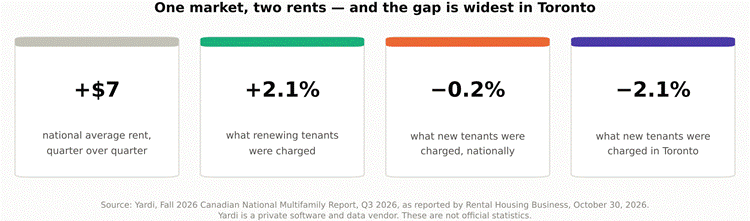
Four numbers from the same report. Two of them point the other way.
What the $7 actually measures
The national average apartment rent reached $1,790 a month, up $7 from the previous quarter, with annual growth across the purpose-built rental sector slowing to 1.7% — described as the weakest reading since the data series began in 2020. The source is Yardi’s Fall 2026 Canadian National Multifamily Report, covering more than 548,000 units across 6,200 properties.
But the same report splits that figure in two, and the split is the story. Rents on units leased to new tenants fell 0.2% compared with the previous lease on the same unit — the third straight quarterly decline. Landlords meanwhile secured average increases of 2.1% on renewals. National vacancy held steady at 4.7%.
In Toronto the gap is nearly twice as wide. Overall rents are up 1.7% annually, while rents on newly signed leases fell 2.1% against the previous lease. That is a 3.8-point spread inside the same buildings.
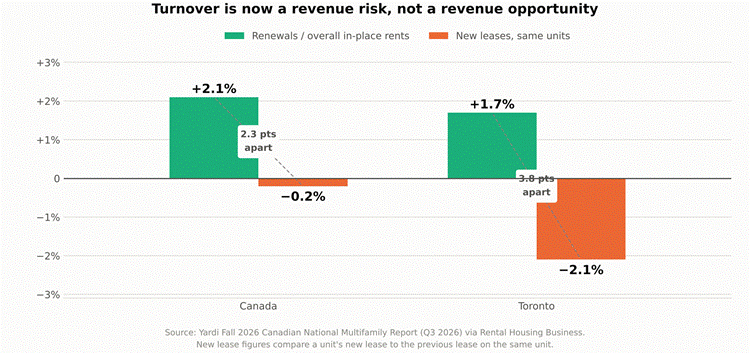
Yardi Q3 2026. Renewal and new-lease figures are for the same portfolios.
Why a building can have two rent trends at once
This is not a measurement artefact. It is Ontario’s rent regulation working exactly as designed.
A sitting tenant’s rent moves by the Ontario rent increase guideline, which the province calculates from the Ontario Consumer Price Index using June-to-May data and caps at 2.5%. A new tenant’s rent is whatever the market will bear on turnover. When market rents are falling and the guideline is positive, the two diverge mechanically — and every unit that turns over resets the rent *down*.
The guideline also does not apply at all to units “occupied for the first time for residential purposes after November 15, 2018.” Newer purpose-built stock has no guideline floor under renewals and no ceiling either, which is why Urbanation’s GTHA purpose-built figures net of incentives behave differently from the regulated stock.
The practical consequence inverts the normal logic of the business. Ordinarily a landlord wants turnover to mark rents to market. Right now turnover is the revenue risk. Toronto’s turnover rate of 17.2% and average tenancy of 51 months — among the lowest tracked — are the reason reported rent growth is still positive at all.
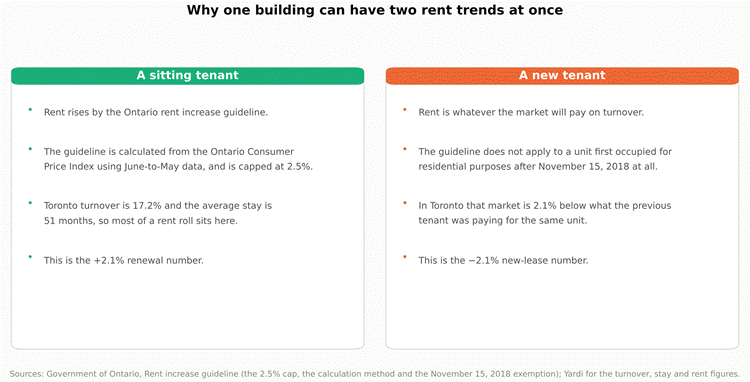
Guideline mechanics from the Government of Ontario; market figures from Yardi.
Three datasets, and they agree
This is worth checking against independent sources, because a single vendor’s series is not evidence. Three datasets, measured three different ways, split along exactly the same line.
Statistics Canada’s rent index rose 2.8% year over year in the September Consumer Price Index, matching August. CPI tracks what the entire stock of renters pays — overwhelmingly sitting tenants. Yardi’s renewal figure is 2.1%. Both measure people who did not move.
On the other side: Yardi’s national new-lease figure is −0.2%, Toronto’s is −2.1%, and Urbanation’s independently collected GTHA figures for the same quarter are −0.6% for condo asking rents and −1.5% for purpose-built rents net of incentives. All four measure the price of a new lease.
Three vendors, one official statistic, and no contradiction between any of them once you ask what each is counting.
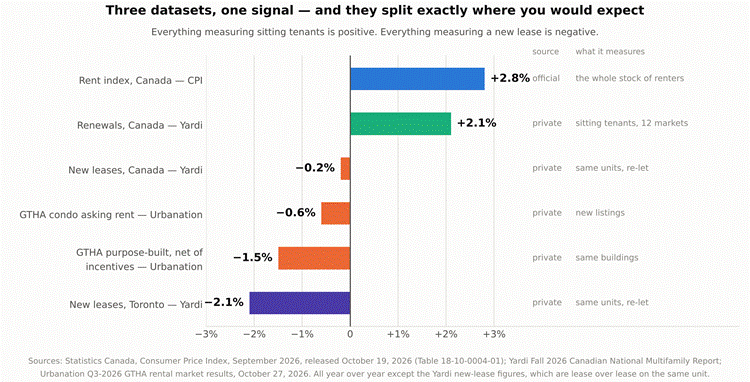
Sources as noted. The official series and the vendor series are measuring different populations.
Where Ontario sits
Yardi publishes no Ontario provincial aggregate — only metros — so the provincial picture has to be assembled from four markets. On the most recent quarter with metro-level detail across all four, new-lease rent growth was −4.5% in Kitchener-Cambridge-Waterloo and −2.8% in Toronto, against +1.3% in Hamilton and +1.5% in Ottawa-Gatineau. Toronto has since deteriorated further, to −2.1% on the Q3 measure.
Yardi attributes the weakness to population growth, pointing “particularly to markets with large immigrant populations, including the Greater Toronto Area.” Hamilton and Ottawa, which have not absorbed the same completion wave, are still positive.
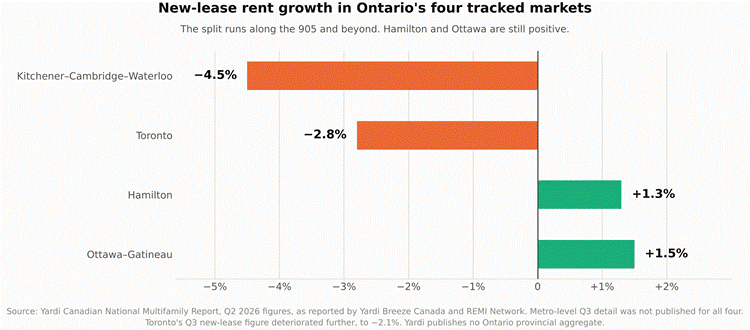
Yardi metro figures. No Ontario provincial aggregate is published.
| THE ULG VIEW Loss to lease has gone negative and nobody is saying it out loud. The standard multifamily underwriting assumption is that in-place rents sit below market, so turnover unlocks value. In Toronto that relationship has inverted: in-place rents sit roughly 2% ABOVE what the same unit re-lets for. Every vacancy is a markdown. If a pro forma still carries a positive loss-to-lease line on a GTA asset, it is overstating stabilised revenue. Model turnover as a cost, not an opportunity. At 17.2% turnover and a −2.1% re-leasing spread, roughly 36 basis points of the rent roll is lost per year to churn alone, before vacancy loss, turn costs and leasing time. That is a real drag and it compounds while market rents stay below in-place. For MLI Select files, the November 15, 2018 exemption cuts both ways. New purpose-built stock escapes the guideline, which is the upside everyone underwrites. The downside is that it also has no regulatory floor: in a falling market, renewals in exempt buildings are negotiated against the same weak market as new leases. The protection that makes older stock resilient right now is the protection new buildings do not have. On land, this strengthens the case rather than weakening it. Falling new-lease rents are a function of a completion wave that is now ending — condo completions fall to 12,065 units in 2028 and 4,213 in 2029, and those starts have not happened. A site entitled now delivers into the other side of this. The rents to underwrite are not today’s. What to watch, with dates. Statistics Canada publishes October CPI on November 16. If the national rent index holds near 2.8% while vendor new-lease figures fall further, the divergence is widening rather than closing, and the gap between what a rent roll reports and what it would re-let for keeps growing. That gap is where acquisition mispricing lives. |
| WHAT IS CONFIRMED AND WHAT IS NOT Private, not official. Yardi is a software and data vendor. The $1,790 average, the $7 quarterly rise, the 1.7% annual growth, the −0.2% new-lease and +2.1% renewal figures, the 4.7% vacancy rate, the Toronto figures and the turnover and length-of-stay data are all from its Fall 2026 Canadian National Multifamily Report as relayed by trade press. The report itself was not retrieved for this note. There is no official Canadian statistic for new-lease rent growth. Confirmed official. The 2.8% rent index is from Statistics Canada, Consumer Price Index, September 2026, released October 19, 2026, Table 18-10-0004-01. The rent increase guideline’s 2.5% cap, its calculation from the Ontario CPI on June-to-May data, and the November 15, 2018 exemption wording are quoted from the Government of Ontario. Confirmed from a second vendor. The GTHA condo and purpose-built figures are from Urbanation’s Q3-2026 rental market results, October 27, 2026. A reconciliation problem worth knowing. The quarterly figures do not tie across the trade reports. A Q3 average of $1,790 up $7 implies $1,783 the prior quarter, but Q2 was reported at $1,774; Q2 at $1,774 up $6 implies $1,768, against $1,761 reported for Q1. The dataset size also moves — 548,000 units across 6,200 properties this quarter against 571,000 across 6,400 earlier in the year. Sample changes or revisions would explain it; no source says which. Treat the quarter-over-quarter dollar figures as directional. Ontario metro figures are from the prior quarter except Toronto, because metro-level Q3 detail was not published for all four markets in the sources reviewed. ULG’s own. The 3.8-point and 2.3-point spreads, the 36-basis-point churn drag, the loss-to-lease inversion argument and the reading that turnover is now a revenue risk. The churn figure is turnover multiplied by the re-leasing spread and excludes vacancy loss, turn costs and leasing time, so it is a floor. This is market commentary, not investment advice. |
Sources
OFFICIAL AND PRIMARY SOURCES
· Statistics Canada — Consumer Price Index, September 2026. Released October 19, 2026. Source of the 2.8% rent index. Next release November 16, 2026. https://www150.statcan.gc.ca/n1/daily-quotidien/261019/dq261019a-eng.htm
· Statistics Canada — Table 18-10-0004-01, Consumer Price Index, monthly. https://www150.statcan.gc.ca/t1/tbl1/en/tv.action?pid=1810000401
· Government of Ontario — Rent increase guideline. Source of the 2.5% cap, the Ontario CPI calculation method and the November 15, 2018 exemption. https://www.ontario.ca/page/rent-increase-guideline
PRIVATE VENDOR DATA — NOT OFFICIAL
· Rental Housing Business — Canadian Apartment Rent Growth Hits Lowest Level Since 2020, October 30, 2026. Reporting Yardi’s Fall 2026 Canadian National Multifamily Report. Source of the Q3 national and Toronto figures. https://www.rentalhousingbusiness.ca/canadian-apartment-rent-growth-hits-lowest-level-since-2020/
· Connect CRE Canada — Canadian Apartment Rent Growth Hits Lowest Level Since 2020. The item that prompted this note. https://www.connectcre.ca/stories/canadian-apartment-rent-growth-hits-lowest-level-since-2020/
· Yardi Breeze Canada — Canadian rental market report. Source of the Kitchener-Cambridge-Waterloo, Hamilton and Ottawa-Gatineau metro figures and the turnover and length-of-stay data. https://www.yardibreeze.ca/blog/2026/09/multifamily-report/
· REMI Network — Multifamily rent growth rests on renewals, July 21, 2026. Reporting the same Yardi series. https://www.reminetwork.com/articles/multifamily-rent-growth-rests-on-renewals/
· Urbanation Inc. — Q3-2026 GTHA rental market results, October 27, 2026. Source of the GTHA condo and purpose-built figures. https://www.urbanation.ca/news/rental-recovery-begins-gtha-vacancy-and-incentives-fall
· Urbanation Inc. — Q3-2026 GTHA condominium market survey, October 19, 2026. Source of the 2028 and 2029 completion figures. https://www.urbanation.ca/news/gtha-new-condo-sales-double-year-ago-q3
Sunny Gawri is real estate sales representative with Royal LePage Signature. Market commentary prepared for discussion. Not investment advice, and not an Opinion of Value for any specific property.