
GTA Commercial Investment Hit $10.2 Billion in June
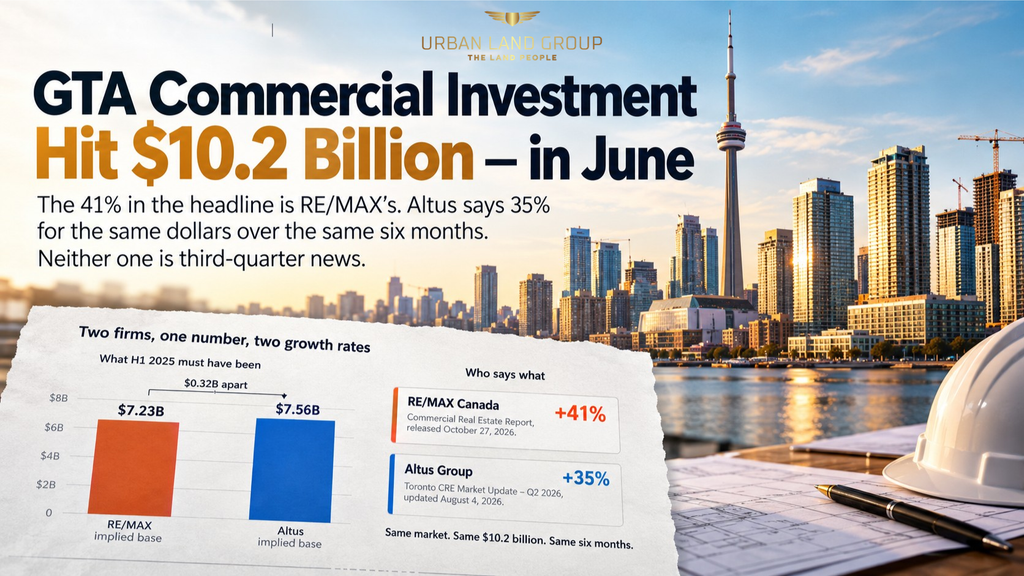
The 41% in the headline is RE/MAX’s. Altus says 35% for the same dollars over the same six months. Neither one is third-quarter news.
October 28, 2026 · Sunny Gawri, Urban Land Group
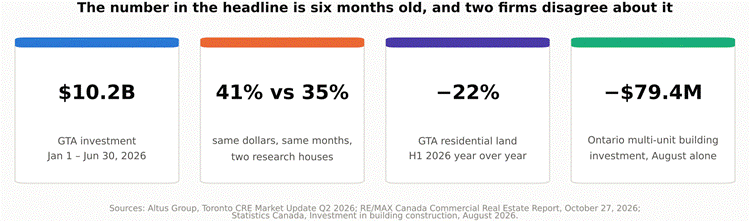
The headline number covers January through June. It was published this week.
Two problems before the number is useful
The first is the date. The $10.2 billion covers January 1 to June 30, 2026. Altus Group published it in its Toronto CRE Market Update for Q2 2026, updated August 4. RE/MAX Canada republished the same period in a commercial report dated October 27, 2026. A headline landing in late October reads as third-quarter momentum. The underlying data stops at June 30, and no Q3 2026 GTA investment total appears to be out yet.
The second is that the two firms do not agree. Altus says GTA investment “rose nearly 35% year-over-year in the first half of 2026, reaching nearly $10.2 billion.” RE/MAX says the same $10.2 billion over the same six months, up 41%. Both cannot be right about the same market. Working backwards, 41% implies a first-half 2025 base of about $7.23 billion; 35% implies about $7.56 billion. The two firms are roughly $0.32 billion apart on what last year looked like, and neither publishes that base figure in the material reviewed.
A third wrinkle is internal to the Altus page itself. Its key highlights and body text both say “first half of 2026,” while the section heading above them reads “In the second quarter of 2026, commercial investment in the Greater Toronto Area saw a 35% increase year-over-year.” Those are different periods. Quote the highlights, not the heading.
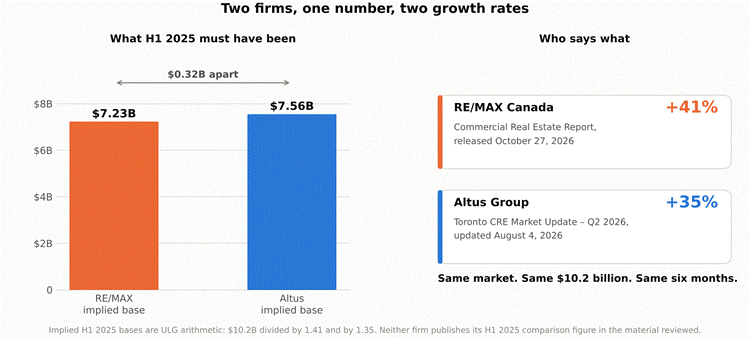
Same dollars, same six months, two growth rates. The gap sits in the 2025 baseline.
Where the money actually went
Industrial was the largest pool at nearly $3.6 billion, up 38%. Multi-family was $2.4 billion, up 244%. Office was nearly $1.2 billion, up 125% — 129 Class A transactions covering roughly 4.2 million square feet, against just 16 Class B deals totalling about 291,000 square feet. Retail fell 30% to just over $925 million.
Altus is blunter about its own number than the coverage is. The report notes that “growth from a severely depressed baseline can overstate underlying momentum,” and describes capital moving “away from speculative, growth-oriented development and toward defensive, yield-generating assets.” A 244% gain on multi-family is a statement about how little traded in the first half of 2025, not only about how much traded this year.
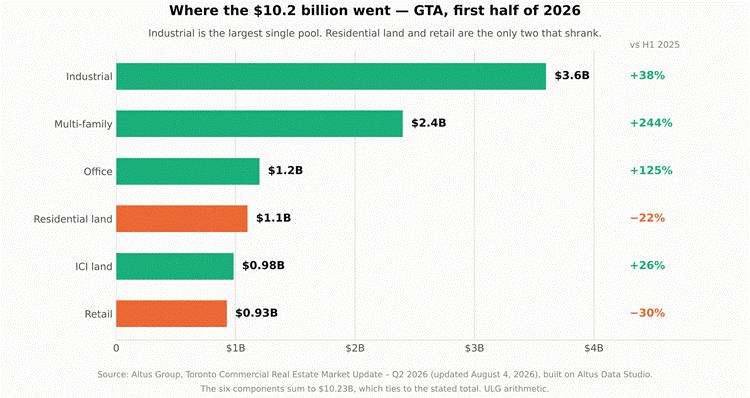
Altus Group, H1 2026. The six components sum to $10.23B, which ties to the stated total.
Land is the category that shrank
Residential land fell 22% to $1.1 billion. Total land — residential plus ICI — came in at nearly $2.1 billion, down 5%. That is the only part of this release that speaks directly to a land business, and it is the part the headline buries.
Altus attributes the residential land decline to “prolonged municipal entitlement timelines, elevated development charges and compounding carrying costs in a stagnant interest rate environment,” and says developers are “prioritizing site plan approvals and density optimization on existing landbanks over acquisitions of unentitled sites.”
ICI land was up 26% to nearly $983 million, but that figure needs reading carefully: Altus says it was “anchored by a major first-quarter Durham Region transaction — a 92-acre Oshawa land assembly acquired by Amazon from Quebec-based developer Broccolini for nearly $124 million.” One deal is roughly an eighth of the category. Strip it out and the ICI gain is far less convincing.
RE/MAX, surveying twelve Canadian markets, ranks land development dead last on improving fundamentals — improving in two of twelve markets, against eleven of twelve for industrial. That is a national brokerage count, not an Ontario measure, but the direction is the same as Altus’s dollars.
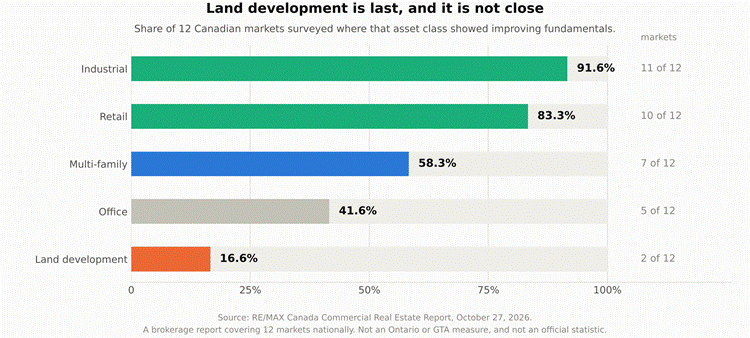
RE/MAX Canada, October 27, 2026. National count across 12 markets, not a GTA statistic.
The official data agrees with the thesis
There is no government statistic for commercial investment volume — that number only exists because brokerages count registrations. But Statistics Canada does publish what is being spent putting up new buildings, and it points the same way.
In Investment in building construction, August 2026 (released October 21), total investment was $23.5 billion, up 0.1% from July and 7.9% year over year. In constant dollars it fell 0.1% — the nominal gain was price, not volume. Non-residential rose 1.0% to $7.4 billion: institutional $2.4 billion (+1.9%), commercial $3.6 billion (+0.8%), industrial $1.5 billion (−0.1%).
The Ontario detail is the point. Institutional investment rose $35.9 million and commercial rose $18.5 million, with StatCan noting the institutional gain was “driven by major projects in the Toronto and Montréal census metropolitan areas.” Industrial slipped $3.0 million. And multi-unit residential fell $79.4 million in Ontario — the largest decline of any province. Capital is buying finished apartment buildings and is not funding new ones at the same pace. That is the article’s own thesis, confirmed in official data it never cites.
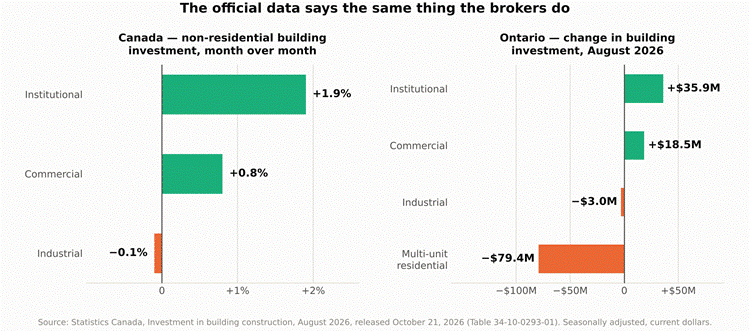
Statistics Canada, August 2026, released October 21. Seasonally adjusted, current dollars.
| THE ULG VIEW Do not carry the 41% into a pitch deck. It is one firm’s number, four months stale, and the research house that produced the underlying dataset says 35%. If a client checks, the discrepancy is the thing they will remember. Cite the dollar figure, name Altus and the period, and move on. The split inside the $10.2 billion is what matters to a land shop. Standing multi-family and industrial are where capital went. Unentitled land is where it did not — down 22%, with Altus naming entitlement timelines, development charges and carrying cost as the reasons. That is not sentiment; those are the same three line items that sit in every residual land value calculation. Read it as a two-track market. A permit-ready multi-family file with an MLI Select path is in the category that rose 244%. A raw or partially entitled land file is in the category that fell 22%. Same market, opposite bid depth, and the gap between them is entitlement risk priced by buyers who have decided they would rather buy the finished product than carry the process. The practical consequence for pricing: on a land disposition, expect the bid to be set by a buyer underwriting a longer approval timeline and a higher carrying assumption than the vendor used. The way to close that gap is to move the file further along before going to market — Altus is describing developers who are optimizing existing landbanks rather than buying new sites, and those are the buyers available. One thing to actually watch: Statistics Canada releases September building construction data on November 19. If Ontario multi-unit residential investment falls again, the pattern of capital favouring existing assets over new supply has a second official data point, and that is a stronger thing to put in front of a client than either brokerage percentage. |
| WHAT IS CONFIRMED AND WHAT IS NOT Confirmed from the publishers. The $10.2 billion H1 2026 total, the 35% figure and every asset-class dollar and percentage above are from Altus Group’s Toronto CRE Market Update – Q2 2026. The 41% figure and the twelve-market fundamentals counts are from RE/MAX Canada’s commercial report dated October 27, 2026. All StatCan figures are from Investment in building construction, August 2026, Table 34-10-0293-01. Not official. Altus and RE/MAX are private research and brokerage firms. Investment volume is not a government statistic and there is no official series to check it against. The two firms’ numbers are counted differently and are not reconcilable from what either publishes. Not verified. No Q3 2026 GTA investment total could be located. The Connect CRE item that carried the 41% headline could not be retrieved directly; the 41% was confirmed from the RE/MAX release it draws on. Altus’s H1 2025 comparison base is not published in the material reviewed. ULG’s own arithmetic. The implied 2025 bases of $7.23B and $7.56B, the $0.32B gap, and the observation that the six asset-class components sum to $10.23B. The reading that one Amazon transaction represents roughly an eighth of ICI land volume is ULG’s calculation from the two figures Altus publishes. |
Sources
OFFICIAL AND PRIMARY SOURCES
· Statistics Canada — Investment in building construction, August 2026. Released October 21, 2026. Next release November 19, 2026. https://www150.statcan.gc.ca/n1/daily-quotidien/261021/dq261021a-eng.htm
· Statistics Canada — Table 34-10-0293-01, Investment in building construction. https://www150.statcan.gc.ca/t1/tbl1/en/tv.action?pid=3410029301
PRIVATE RESEARCH AND BROKERAGE — NOT OFFICIAL
· Altus Group — Toronto Commercial Real Estate Market Update, Q2 2026 (updated August 4, 2026). Jennifer Nhieu and Lucy Wu-Yu. Source of the $10.2B total, the 35% figure and every asset-class breakdown. A private research firm. https://www.altusgroup.com/insights/toronto-commercial-real-estate-market-update-q2-2026/
· RE/MAX Canada — Commercial Real Estate Report, released via CNW, Toronto, October 27, 2026. Source of the 41% figure and the twelve-market fundamentals counts. A brokerage. https://www.newswire.ca/news-releases/commercial-real-estate-investment-gains-momentum-in-select-canadian-markets-as-demand-for-prime-assets-holds-firm-838970061.html
· RENX — “CRE investment in Toronto area up 35 per cent in first half of 2026,” August 26, 2026. Trade press reporting the Altus figure at 35%. https://renx.ca/cre-investment-in-gta-up-35-per-cent-from-2025
· REMI Network — “GTA investment rebounds driven by multifamily growth,” August 19, 2026. Trade press, also 35%. https://www.reminetwork.com/articles/gta-investment-rebounds-driven-by-multifamily-growth/
· Connect CRE Canada — “GTA CRE Investment Jumps 41% To $10.2B As Buyers Favour Existing Assets.” The item that prompted this note. Could not be retrieved directly for verification. https://www.connectcre.ca/stories/gta-cre-investment-jumps-41-to-10-2b-as-buyers-favour-existing-assets/
Urban Land Group · Land development advisory and commercial real estate · 30 Eglinton Avenue West, Mississauga, Ontario
Sunny Gawri is a registered real estate sales representative with Royal LePage Signature. Market commentary prepared for discussion. Not investment advice, and not an Opinion of Value for any specific property.