
Wholesale Sales Fell. The Warehouse Number Went The Other Way.
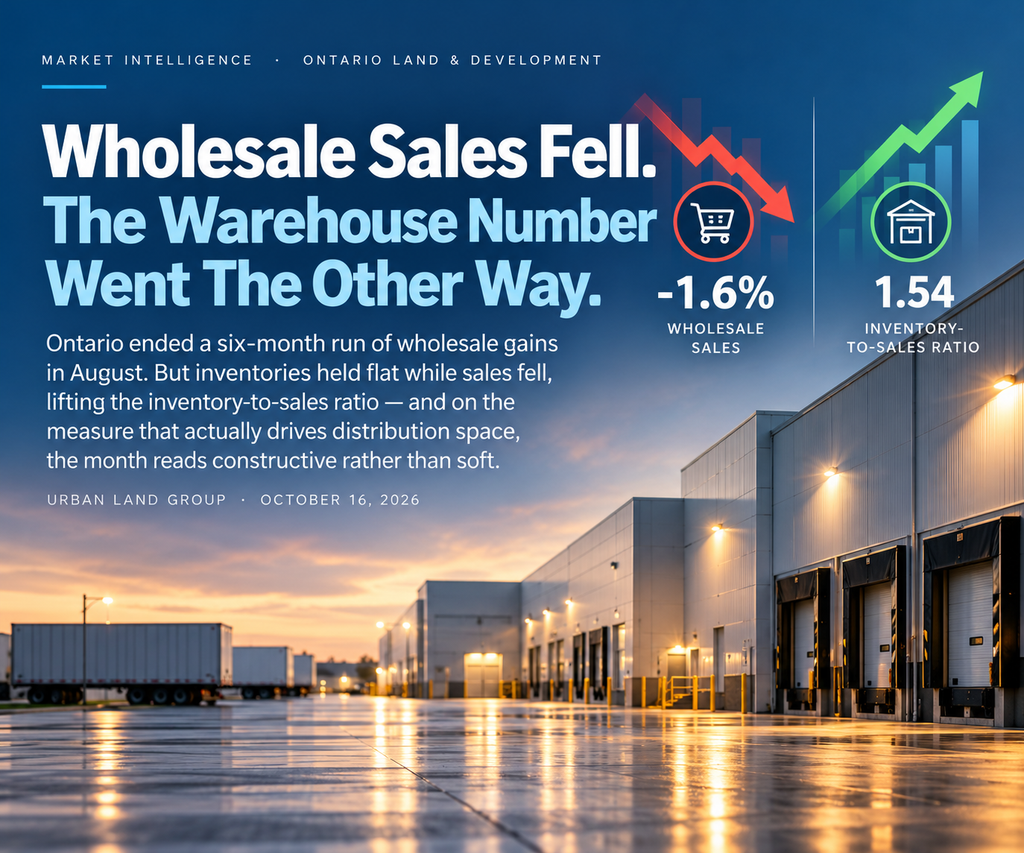
Ontario ended a six-month run of wholesale gains in August. But inventories held flat while sales fell, lifting the inventory-to-sales ratio — and on the measure that actually drives distribution space, the month reads constructive rather than soft.
Urban Land Group · October 16, 2026
Statistics Canada released wholesale trade figures for August 2026 on October 15. National wholesale sales fell 1.6% to $91.6 billion, and in volume terms — chained 2012 dollars — sales fell 1.8%. Sales declined in five of seven subsectors, representing 70.6% of total wholesale activity. The figures exclude petroleum, petroleum products and other hydrocarbons, and oilseed and grain.
Ontario fell 1.6% to $47.8 billion, ending six consecutive months of increases, with motor vehicle and motor vehicle parts and accessories down 3.7% to $10.5 billion doing most of the damage within the province. Six provinces reported lower sales, led by Ontario in dollar terms and followed by Saskatchewan.
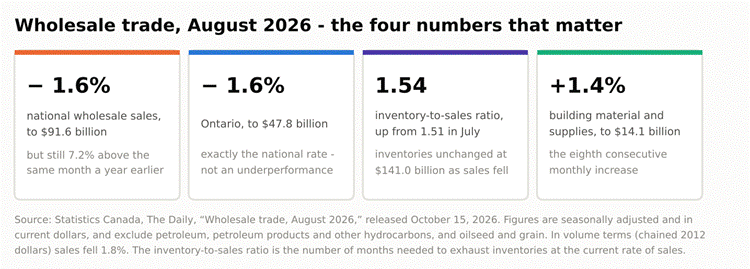
Two of these four numbers are the ones the headline misses.
Ontario led in dollars, not in weakness
Ontario’s 1.6% decline matched the national rate exactly. It led the national decline because it is the largest wholesale province, at $47,791.1 million of a $91.6 billion national total — roughly 52% of the country’s wholesale activity. On a percentage basis four provinces fell harder: Saskatchewan at 8.2%, British Columbia at 2.4%, New Brunswick at 2.0% and Quebec at 1.7%. Four provinces rose.
The annual comparison is also worth keeping in view. National sales in August were 7.2% higher than the same month a year earlier. This is a soft month inside a strong year.
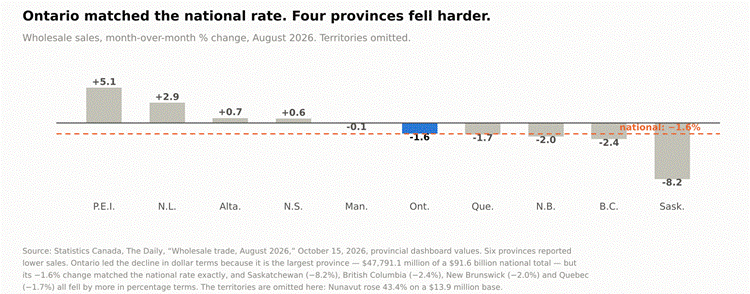
The dashed line is the national rate. Ontario sits on it.
The measure that prices a warehouse moved the other way
Wholesale sales are a flow. The number that corresponds to occupied distribution space is the stock — inventories — and the relationship between the two. In August, aggregate wholesale inventories were unchanged at $141.0 billion while sales fell, and the inventory-to-sales ratio rose from 1.51 in July to 1.54 in August. Statistics Canada defines that ratio as the number of months needed to exhaust inventories at the current rate of sales.
Goods are not clearing as quickly. In the near term that means more months of stock sitting in the same buildings, which is more occupied space per dollar of sales rather than less. Read strictly as a demand signal for distribution real estate, this print is mildly constructive. The bearish signal for warehouse demand is destocking — inventories falling alongside sales — and in aggregate that did not happen.
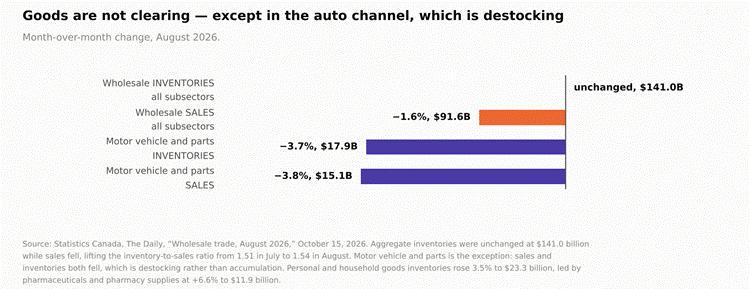
Aggregate inventories held while sales fell. The auto channel did the opposite.
The exception is the auto channel, and it is a real one. Motor vehicle and parts is the single subsector where both sides fell: sales down 3.8% to $15.1 billion nationally, inventories down 3.7% to $17.9 billion. That is destocking, and destocking is what releases space. Partly offsetting it, personal and household goods inventories rose 3.5% to $23.3 billion, led by pharmaceuticals and pharmacy supplies at 6.6% to $11.9 billion.
And one subsector that has now risen for eight straight months
Building material and supplies rose 1.4% to $14.1 billion, an eighth consecutive monthly increase, led by lumber, millwork, hardware and other building supplies at 3.3% to $6.6 billion. Eight consecutive months is a trend in a way that no single month in this release is, and it sits alongside the multi-unit residential strength in Tuesday’s building permit print. The construction supply chain is running.
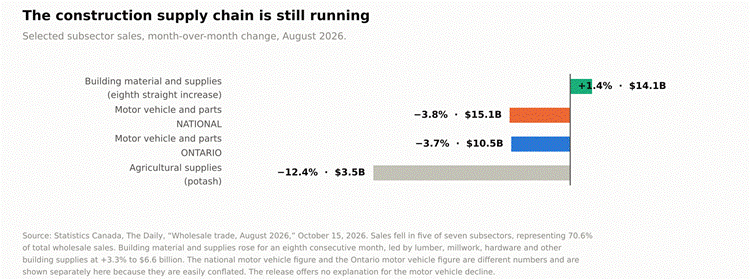
The national and Ontario motor vehicle figures are different numbers and are shown separately because they are easily conflated.
| THE ULG VIEW Two figures in the brief need correcting before anything is built on them. The −3.7% to $10.5 billion is Ontario’s motor vehicle and parts number, not the national one. Nationally the subsector fell 3.8% to $15.1 billion. And the release contains no mention of tariffs, trade policy, exports, imports or United States demand. The only explanatory comment Statistics Canada offers anywhere in the document is a remark that potash company sales were lower. A tariff or original-equipment-manufacturer reading of the motor vehicle decline is an inference, and it should travel labelled as one. “Ontario led the decline” is a dollar statement, not a performance statement. Ontario fell 1.6% — exactly the national rate. It led because it is the largest province, at $47,791.1 million of a $91.6 billion national total. In percentage terms Saskatchewan fell 8.2%, British Columbia 2.4%, New Brunswick 2.0% and Quebec 1.7%, all harder than Ontario. And national sales remain 7.2% above the same month last year. This is a soft month inside a strong year, not Ontario underperforming the country. The number that actually prices a warehouse is the inventory-to-sales ratio, and it moved the other way. Aggregate wholesale inventories were unchanged at $141.0 billion while sales fell, lifting the ratio from 1.51 in July to 1.54 in August. More months of stock are sitting in the boxes. In the near term that is more occupied cubic footage per dollar of sales, not less. Read as a demand signal for distribution space, this print is mildly constructive, not soft. The auto channel is the genuine exception, and that is where the 401 and 407 caution belongs. Motor vehicle and parts is the one subsector where sales and inventories fell together — sales down 3.8% to $15.1 billion, inventories down 3.7% to $17.9 billion. That is destocking, not accumulation, and destocking is what actually releases warehouse space. So the instinct about auto-supply-chain product on the 401 and 407 corridors is right, but for a narrower and better reason than a general reading of soft wholesale demand. Hold rent-growth assumptions conservative on auto-tied bays specifically. Do not extend that to GTA distribution product generally on this print. Building materials is the quiet corroboration of Tuesday’s permit number. Building material and supplies rose 1.4% to $14.1 billion — an eighth consecutive monthly increase — led by lumber, millwork, hardware and other building supplies at 3.3% to $6.6 billion. Eight straight months is a trend, unlike a single month of anything else in this release. The construction supply chain is running, which is consistent with multi-unit authorizations rising and inconsistent with a broad cooling story. On pairing this with the commercial permit decline, be careful. Commercial building permits fell $380.0 million in August, and that is a real signal about the non-residential development pipeline. But a building authorization measures intent to construct, while wholesale trade measures goods already moving. They are different clocks. The permit print says less commercial space is being authorized; this print says the space already built is holding more inventory. Treating them as one cooling signal double-counts a conclusion neither one supports on its own. What would make this a trend. Two or three consecutive months of falling aggregate inventories alongside falling sales — real destocking rather than accumulation — and a continued fall in the motor vehicle channel. Statistics Canada publishes an advance September estimate on October 26 and the full September release on November 13. Those are the dates, not another single print. |
| WHAT IS CONFIRMED AND WHAT IS NOT Everything quoted here was verified against the Statistics Canada release of October 15, 2026. The $91.6 billion national level, the 1.6% decline, the 1.8% volume decline, Ontario at −1.6% and $47,791.1 million ending six consecutive monthly increases, the Ontario motor vehicle figure of −3.7% to $10.5 billion, the national motor vehicle figure of −3.8% to $15.1 billion, inventories of $141.0 billion and the 1.51 to 1.54 ratio all appear as published. The release says nothing about tariffs, trade or United States demand. It offers one piece of explanatory colour in the entire document, on potash. Any causal story about the motor vehicle decline — including a tariff or OEM story — is analyst inference and is not supported by this source. The figures exclude petroleum and grain. Statistics Canada excludes petroleum, petroleum products and other hydrocarbons, and oilseed and grain, from monthly analysis. Those series remain in the data tables but are not in these headline numbers. Inventories are described as “unchanged,” not given a percentage. The release states the level at $141.0 billion and characterises the month-over-month change as unchanged rather than publishing a figure. Three of the five declining subsectors are unnamed in the release. Statistics Canada reports that sales fell in five of seven subsectors representing 70.6% of total wholesale sales, but quantifies only some of them. The unnamed components cannot be assessed from this source. Wholesale trade is a proxy for industrial absorption, not a measure of it. It describes goods moving through distribution channels nationally and provincially. It does not measure square footage leased, vacancy, or rent in any market, and it is not a substitute for GTA industrial market data. Statistics Canada notes that this release was prepared with the assistance of a generative artificial intelligence tool and refined and verified by its own experts. That note appears in the release and is reproduced here for completeness. |
SOURCES
Official and primary sources
· Statistics Canada — The Daily, Wholesale trade, August 2026, released October 15, 2026 https://www150.statcan.gc.ca/n1/daily-quotidien/261015/dq261015b-eng.htm
· Statistics Canada — Wholesale trade, sales and inventories (Table 20-10-0074-01) https://www150.statcan.gc.ca/t1/tbl1/en/tv.action?pid=2010007401
· Statistics Canada — The Daily, Building permits, August 2026, released October 14, 2026 https://www150.statcan.gc.ca/n1/daily-quotidien/261014/dq261014a-eng.htm
· Statistics Canada — Monthly Wholesale Trade Survey, definitions and methodology https://www23.statcan.gc.ca/imdb/p2SV.pl?Function=getSurvey&SDDS=2401
· CMHC — Fall 2026 Housing Supply Report, September 10, 2026 https://www.cmhc-schl.gc.ca/professionals/housing-markets-data-and-research/market-reports/housing-market/housing-supply-report
Prepared by Urban Land Group. Sunny Gawri is a registered sales representative with Royal LePage Signature Realty, Brokerage. This document is market commentary prepared for discussion purposes. All arithmetic and all causal interpretation identified as ULG commentary is our own and is not sourced from Statistics Canada or any government body. Nothing here is an appraisal, an Opinion of Value, or investment, legal or tax advice.